

Release Notes Through 2026-9-17
Overview
Slide Inspector (Beta)
Slide is an always-encrypted BCDR (business continuity and disaster recovery) platform built for MSPs, with on-site Slide Box appliances that protect endpoints and replicate verified snapshots to Slide Cloud. You can now use the Slide Inspector (Beta) to bring Slide Box health, backup agent status, and snapshot verification results into Liongard — so a failed backup, a paused agent, or a deactivated appliance shows up the moment it happens, without logging into the Slide Console.
What you can monitor
- Slide Box appliance inventory and service status
- Backup agent inventory, backup schedule, and pause state
- Latest backup status and snapshot verification (boot, filesystem, service) per agent
- Open and recently-resolved Slide alerts
- Total protected storage and appliance warranty expiration
Benefits
- Confirm every managed customer's Slide Boxes are active and checking in.
- Catch failed, paused, or missed backups before a customer needs a restore.
- Track snapshot verification so "backups exist" also means "backups are recoverable."
- Surface storage-critical and appliance-out-of-date alerts across the fleet.
Beta: This inspector is currently available as a Beta feature. Functionality may evolve as we continue to enhance the integration based on partner feedback.
Please review our documentation to learn more about this inspector.
Iru Inspector (Beta)
Iru (formerly Kandji) is an Apple-first device management (UEM/MDM) platform. You can now use the Iru Inspector (Beta) to gain visibility into your managed customers' Apple device fleets directly from Liongard, with each managed device mapped to its own Environment for independent posture tracking.
What you can monitor
- Apple device inventory — Macs, iPhones, iPads, and Apple TVs
- FileVault encryption, Supervised, and Activation Lock status
- Blueprint (configuration template) assignments
- Iru agent version and last check-in
- EDR threat events and CVE vulnerability detections (when the tenant is licensed)
Benefits
- Catch a Mac whose FileVault is disabled or whose Supervision is lost.
- Get alerted the moment a new active EDR threat or a new Critical CVE appears in a customer's fleet.
- Track Iru agent removal or downgrade, and devices that stop checking in.
Beta: This inspector is currently available as a Beta feature. Functionality may evolve as we continue to enhance the integration based on partner feedback.
Please review our documentation to learn more about this inspector.
GitHub Copilot Inspector (Beta)
GitHub Copilot for Business/Enterprise is GitHub's per-seat AI coding assistant. You can now use the GitHub Copilot Inspector (Beta) to bring seat inventory, usage adoption, and governance policy into Liongard — so an idle seat draining budget, a governance policy silently loosened, or a subscription that quietly lapsed shows up on the same timeline as every other system you monitor.
What you can monitor
- Seat inventory and assignment — total, active, inactive, pending cancellation, and pending invitation
- Org governance policy — public code suggestions, IDE chat, CLI, and seat management mode
- 28-day usage analytics by editor/IDE, language, and model
- Content exclusion rules (public preview) and estimated monthly cost
Benefits
- Track seat inventory and flag inactive seats (no activity in 30+ days) as right-sizing candidates.
- Monitor 28-day usage adoption to demonstrate developer-tooling ROI.
- Detect governance-policy drift, and catch a customer's Copilot subscription disappearing entirely.
Beta: This inspector is currently available as a Beta feature. Functionality may evolve as we continue to enhance the integration based on partner feedback.
Please review our documentation to learn more about this inspector.
iboss Inspector (Beta)
iboss Zero Trust SSE is a cloud-native Secure Service Edge platform — web filtering, HTTPS decryption, DLP, firewall rules, and Zero Trust Network Access, all enforced from one cloud inspection path. You can now use the iboss Inspector (Beta) to snapshot an account's entire security configuration daily, so a disabled policy layer, a drifted allowlist, or an expiring API key surfaces without logging into the iboss Admin Console.
What you can monitor
- Cluster and node topology, security policy layers, and allow/block entries
- Proxy users and devices, including devices left in the default policy group
- Locations, private networks, SSL decryption posture, and DLP rules
- Firewall rules, ZTNA routed peers, and licensed module entitlements
- Days remaining until the iboss API key expires
Benefits
- Catch a security policy that was disabled during troubleshooting and never re-enabled.
- Find devices stuck in the default policy group running the weakest ruleset.
- Get alerted 30 days before the iboss API key expires — before it silently breaks every iboss integration you run.
Beta: This inspector is currently available as a Beta feature. Functionality may evolve as we continue to enhance the integration based on partner feedback.
Please review our documentation to learn more about this inspector.
Corero SmartWall Inspector (Beta)
Corero SmartWall ONE is an on-premise and hybrid DDoS protection platform for enterprises and service providers. You can now use the Corero SmartWall Inspector (Beta) to roll up appliance inventory, license state, and recent DDoS attacks and mitigations into Liongard's inventory and change-detection trail — in either a single-tenant Enterprise deployment or a multi-tenant Service Provider deployment that auto-discovers each managed customer.
What you can monitor
- Appliance inventory (NTD/vNTD/TDS/TDD) with model, serial, software version, and connection state
- Installed Smart-Plugins and their version and status
- License type, capacity, validity, and expiry
- Recent DDoS attacks and mitigations, with per-tenant attribution (Service Provider mode)
Benefits
- Catch a license nearing expiry, or a licensed-capacity ceiling, before it becomes an outage.
- See an appliance disconnect or a Smart-Plugin version change as soon as it happens.
- Get per-tenant DDoS attack and mitigation attribution for reporting and incident review, without leaving Liongard.
Beta: This inspector is currently available as a Beta feature. Functionality may evolve as we continue to enhance the integration based on partner feedback.
Please review our documentation to learn more about this inspector.
ImmyBot Inspector (Beta)
ImmyBot is an MSP endpoint-automation platform for software deployment, patching, and computer onboarding. You can now use the ImmyBot Inspector (Beta) to bring automation and software-deployment posture into Liongard — integration health, recurring maintenance failures, computers excluded from patching, and deployment changes — with each customer tenant mapped to its own Environment.
What you can monitor
- Instance-wide software library, maintenance schedules, and connected RMM/PSA integration health
- Per-tenant managed computers, online/offline state, and computers excluded from maintenance
- Recent (7-day) maintenance and patch session results, including failures
- Configured software deployments and licenses per tenant
Benefits
- Catch a patching or maintenance failure streak for a customer before it becomes a support ticket.
- See an RMM/PSA integration go unhealthy the moment it happens, instead of at the next manual check.
- Track computers quietly excluded from maintenance — the classic way patch coverage erodes unnoticed.
Beta: This inspector is currently available as a Beta feature. Functionality may evolve as we continue to enhance the integration based on partner feedback.
Please review our documentation to learn more about this inspector.
Barracuda Email Gateway Defense Inspector (Beta)
Barracuda Email Gateway Defense (EGD) is Barracuda's cloud-native email security service, managed through Barracuda Cloud Control (BCC). You can now use the Barracuda Email Gateway Defense Inspector (Beta) to pull account status, managed-domain verification, and 30-day mail-flow statistics for every EGD account your MSP manages into a single view — without logging into BCC account by account.
What you can monitor
- EGD account status (Active/Suspended/Disabled) and region (US/UK)
- Managed domain inventory and verification status (Verified/Unverified/Disabled)
- 30-day mail-flow totals: allowed, blocked, deferred, quarantined
- 30-day blocked-threat breakdown — phishing, malware, spam, domain impersonation
Benefits
- Confirm every managed customer's EGD account is Active and every managed domain is Verified from one dashboard.
- Catch a domain that drops to Unverified or Disabled before a customer's mail flow breaks.
- Pull 30-day allowed/blocked/phishing/malware counts straight into monthly customer reviews.
Beta: This inspector is currently available as a Beta feature. Functionality may evolve as we continue to enhance the integration based on partner feedback.
Please review our documentation to learn more about this inspector.
Nerdio Manager for MSP Inspector (Beta)
Nerdio Manager for MSP (NMM) is a cloud management platform built for MSPs running Azure Virtual Desktop (AVD) and Windows 365 at scale, giving Partners centralized provisioning, autoscaling, image management, and session monitoring across many Customer Azure tenants from a single control plane. You can now use the Nerdio Manager for MSP Inspector (Beta) to bring AVD workspace, host pool, session, and backup posture into Liongard for every Customer account a Partner manages through NMM — so configuration drift, a stale desktop image, or a backup gap shows up without logging into NMM per Customer.
What you can monitor
- AVD workspace, host pool, and session host inventory per Customer
- Active user sessions, including UPN, application type, and session state
- Desktop image inventory with last-activity change-log enrichment
- Autoscale profile configuration, both MSP-global and Customer-scoped
- Backup-protected items and Azure recovery vaults per Customer
- NMM control-plane platform health (app service, web job, and database status)
Benefits
- Catch AVD configuration drift — autoscale settings, load balancer type, session limits — per Customer.
- Surface backup-protected items and recovery vaults for compliance reporting without opening NMM.
- Roll up NMM platform health across a Partner's entire installation.
- Spot host pool or session host count drops from decommissioning or deletion.
- Identify Customers running stale desktop images via the change-log enrichment.
Beta: This inspector is currently available as a Beta feature. Functionality may evolve as we continue to enhance the integration based on partner feedback.
Please review our documentation to learn more about this inspector.
CIPP Inspector (Beta)
CIPP (CyberDrain Improved Partner Portal) is the open-source, self-hosted multi-tenant Microsoft 365 management platform many Partners already use to manage every Customer's M365 tenant through Microsoft's GDAP delegated-admin model. You can now use the CIPP Inspector (Beta) to bring each managed tenant's Secure Score, license utilization, Conditional Access posture, standards compliance, and Defender incidents into Liongard — turning one CIPP instance into per-Customer configuration-drift monitoring across a Partner's whole M365 book of business.
What you can monitor
- GDAP delegated-admin relationship health, including relationships nearing expiry
- Microsoft Secure Score per managed tenant
- Conditional Access policy configuration and drift
- CIPP Standards compliance state
- License SKU counts and utilization
- MFA coverage (legacy per-user state) and dormant accounts (no sign-in in 180+ days)
- Open Microsoft 365 Defender security incidents
- New or removed managed tenants
Benefits
- Catch a Conditional Access policy being disabled or deleted before it becomes an incident.
- Get ahead of a GDAP relationship expiring, which would silently cut off management access to a Customer's tenant.
- Detect a Microsoft Secure Score decline before the next security review.
- Spot dormant accounts still consuming licenses and representing attack surface.
- Track license SKU counts per Customer for true-up and rightsizing conversations.
Beta: This inspector is currently available as a Beta feature. Functionality may evolve as we continue to enhance the integration based on partner feedback.
Please review our documentation to learn more about this inspector.
Asset Inventory: Purge Deleted Records
You can now permanently purge soft-deleted records from Asset Inventory. A new Purge Deleted bulk action on the Devices and Identities & Accounts tables lets you hard-delete records that are already marked deleted — by manual selection or by filter — so they stop counting toward inventory and can't reappear on a later inspection.
What's New
- A Purge Deleted bulk action on the Devices and Identities & Accounts tables in Asset Inventory
- Purge by manual selection or by filter
- A confirmation step before purging, since the action is irreversible
- An Activity Log entry recorded for every purge
This closes a recurring pain point where soft-deleted records could reappear on a later inspection and affect billing counts. The purge action is available to all Asset Inventory partners automatically, with no setup required.
Inspector Auto-Pause: Visibility and Resume
Liongard now shows at a glance when an inspector has been auto-paused, and gives you a one-click way to bring it back.
What's New
- Auto-paused inspectors now display a "- Paused" status badge in both the Admin > Inspectors list and an Environment's Systems tab
- A one-click Resume action (with confirmation) restarts a paused inspector without editing its configuration
- Resuming an inspector — or any successful run — resets the consecutive-failure counter and restores its normal schedule
Previously, recovering a paused inspector meant digging into its configuration to find out why it stopped. Now the pause is visible where you're already looking, and getting it running again takes one click.
System Details Enhancements: New Top Navigation + Faster, More Powerful Tables
The System Details page's left-hand navigation is replaced with five tabs across the top — System Details, Alerts, Changes, Metrics, and System Notes — each showing a record count. The active tab persists across a refresh, overflow collapses into a More menu on smaller screens, and the page is fully keyboard-navigable. This is a navigation and layout change only — no underlying data changes, and every existing header action still works the same way.
The data tables within System Details — Alerts, Changes, Metrics, and more — are upgraded to the same AG Grid component already used elsewhere in Liongard. Expect faster load and scroll on large datasets, resizable and reorderable columns, and more consistent sort and filter behavior. This ships alongside the new top navigation above, in the same release. It's a technology and performance upgrade only — the underlying data hasn't changed.
Veeam Service Provider Console Child: Volume-Level Backup Reporting
The Veeam Service Provider Console (VSPC) Child Inspector's System Details page now includes a dedicated Backups section covering both servers and workstations — backup job name, protected host, machine type, protected drive(s)/volume(s), status, last backup date, size, retention policy, and location — so you can spot an un-backed-up machine without opening the Veeam console.
What You Need to Know
As part of this change, four metrics — Backup Proxies Out of Date (List and Count) and Backup Proxies Disabled (List and Count) — move from the Parent Inspector (console-wide) to the Child Inspector (per-environment). After this release, these four metrics no longer report on the Parent. If you have alerts or dashboards built on those metrics at the Parent level, expect the values to shift to per-environment scope — this is an intentional accuracy improvement, not data loss.
Visual Insights: Cyber Essentials Pre-Assessment Dashboard
A new Cyber Essentials Pre-Assessment dashboard template is now available in Visual Insights, joining the existing POPIA, HIPAA, and NIS2 compliance templates. It maps live inventory data — from Active Directory, Windows Workstation/Server, macOS, and Microsoft 365 — directly onto the five Cyber Essentials v3.2 control themes: Firewalls, Secure Configuration, Security Update Management, User Access Control, and Malware Protection.
Use it to get a single view of compliance percentages and drill into the specific devices, accounts, or mailboxes behind a gap, instead of gathering evidence by hand across multiple consoles. This dashboard is a readiness and gap-analysis tool; it is not the official IASME/NCSC certification submission.
This template is available to new and existing partners with the Visual Insights Pro add-on.
Visual Insights: Roar Designer (AI-Assisted Widget & Dashboard Builder)
Roar Designer is a new AI-assisted way to build Visual Insights dashboards and widgets using natural language instead of manually configuring visuals or writing SQL. Describe what you want — for example, "make me a Windows workstation dashboard" — and Roar Designer generates a working widget backed by transparent, human-readable YAML you can view, hand-edit, or copy into an external AI tool for further customization.
What's New
- A new Query Widget type, alongside the existing Classic Widget, that surfaces the Roar Designer prompt field for natural-language widget creation
- Reusable Query Datasets that let a complex query — a specific join or calculation — be defined once and referenced by multiple widgets instead of being rebuilt each time
- Generated widgets stay editable as YAML, so you can refine them by continuing the conversation with Roar Designer, hand-editing the YAML directly, or round-tripping it through an external AI tool
Roar Designer complements rather than replaces the existing widget builder — Classic Widgets remain fully supported and unaffected, with no migration required. It's available today to all partners, with no opt-in required.
To learn more about this feature, please review our documentation.
Liongard Roar Assistant: PSA Ticket Insights
Liongard's AI assistant can now read PSA ticket data alongside the configuration and alert data it already tracks — across ConnectWise, Autotask, HaloPSA, Kaseya BMS, Syncro, and ServiceNow.
What You Can Do
Ask plain-English, customer-scoped questions (mention the environment with @) such as "How many open tickets does this customer have, by priority?" or "Which Liongard alerts already have a PSA ticket?" — and tie a ticket back to the exact configuration change that caused it. Access is strictly read-only across all six PSAs. HaloPSA additionally supports optional, opt-in write actions — create a ticket, add a note, log time, or assign — as a separate capability. Answers are live reads against the PSA vendor API at query time, not a cached snapshot.
To learn more about this feature, please review our documentation.
Asset Inventory: Related Systems Filter Now Requires All Selected Systems
The Related Systems filter on the Devices and Identities & Accounts tables in Asset Inventory now returns records that match every system you select, instead of records that match any of them. Selecting Windows Server and CrowdStrike, for example, now shows only the devices running both — not every Windows Server device and every CrowdStrike-protected device combined.
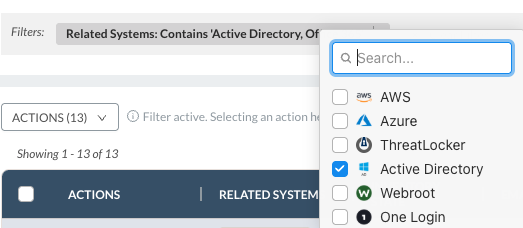
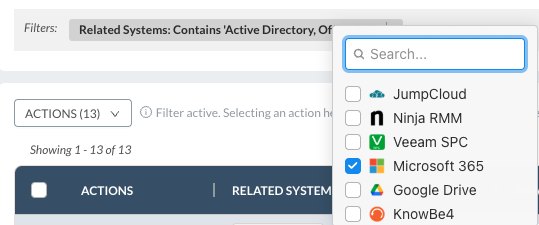
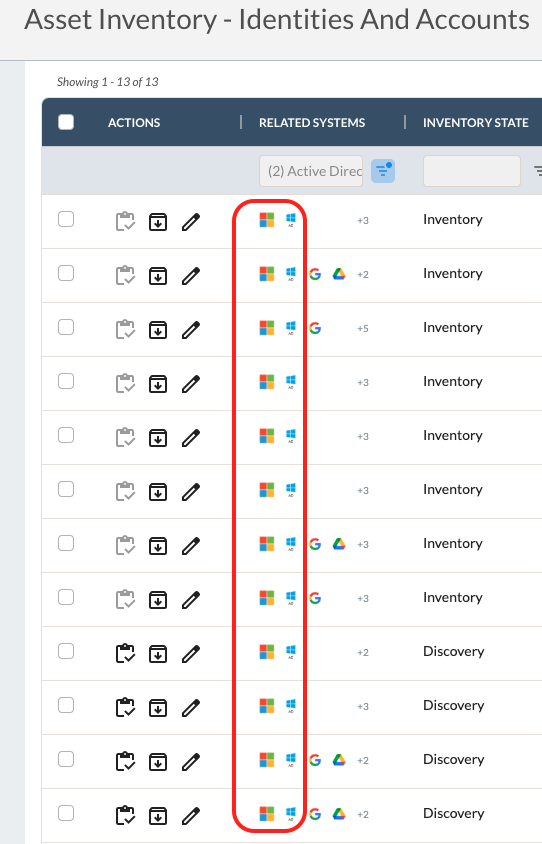
The Select All option is removed from the filter, since requiring every possible related system at once would always return zero results.
Minor Updates and Bug Fixes
Platform and Gen AI Minor Updates and Bug Fixes
- Added persona-aware AI summaries for both System and Environment views, so the summary emphasizes what matters most to your role, plus a multi-select AI perspectives/interests override on the user profile (auto-populated from your profile's Department).
- Added the ability to select an AI model for Roar Assistant, with a company-wide default and a per-user override.
- Added an on-demand, row-level AI change summary (via a sparkle icon) and copy, export, and feedback actions on the Summary tab.
- Roar Assistant responses now declare the date range and "as of" date they're based on.
- Fixed an issue where Roar Assistant lost the @-tagged system scope on follow-up questions, sometimes resolving to a same-named system in the wrong environment.
- Fixed an issue where Roar Assistant returned an incorrect admin count for @-tagged systems due to an inspector-scoping leak.
- Fixed an issue where deictic questions (for example, "tell me about this system") failed to resolve the page you were viewing and returned "could not find matching data."
- Fixed an issue where a follow-up, ticket-detail question could repeat the prior PSA aggregate answer instead of answering the new question, and where PSA ticket questions could be hijacked by the alert recipe.
- Fixed a bug where Roar Assistant responses could appear duplicated in the conversation thread.
- Fixed an issue where the chat history limit could surface a raw error in long conversations; added a sliding context window to better support longer conversations.
- Network Topology Explorer now auto-centers the view when you select a node, simplifies Internet Exposure to plain Yes/No text, and is collapsed by default with the graph lazy-loaded on expand (with a saved default-state preference). Also fixed filtered device results not appearing after filtering from the expanded view, the mini-map disappearing and Fit to Window becoming unresponsive after switching subnet views, and the empty state not rendering correctly.
- Fixed an issue where the Asset Inventory Devices table could hang and freeze the browser tab for very large environments.
- Asset Inventory's Devices grid now uses device-type-specific icons, and a device icon that was invisible in dark mode is fixed.
- Added closable QuickViews tabs to System Details and Asset Inventory, and fixed an issue that allowed duplicate QuickView names to be saved on the same table.
- Fixed an issue where Related Systems icons were hidden in the Devices table.
- Fixed an issue where paginated tables reset to page 1 after drilling into a record and navigating back.
- Fixed an issue where clicking a scheduled report's frequency could open an invalid URL and show an Internal Server Error.
- Fixed an issue where the Inspector Dashboard's failed count didn't match the Inspectors list, and where discovered launchpoints showed an incorrect count.
- Fixed an issue where assigning the AI User role appeared to save successfully but the role assignment did not persist, and an issue where a user role update could fail with an "Invalid Groups" error.
- Fixed several Actionable Alerts issues, including alerts that displayed raw data instead of the standard change-detection format and inconsistent metric display between a rule's details and its linked metric; fixed a regression where applying a template during rule creation returned a server error.
- Fixed a database sequence overflow that was silently failing identity-audit writes, and an issue where the Environment page/dashboard could return a 400 error under database connection exhaustion.
- Inspectors in early access now show a LABS badge alongside the existing BETA badge, so you can tell the two stages apart at a glance.
- Fixed a Content-Security-Policy header that was set to Report-Only mode and providing no actual protection, and an issue where a bearer token could be exposed in an integrations API response.
- Added a DNS zone change-detection metric, a Hyper-V host serial number field in Asset Inventory, and expanded Microsoft 365 Intune & Conditional Access metric coverage.
Integration and Inspector Minor Updates and Bug Fixes
- Addigy
- Fixed an issue in the Addigy Child inspector where device counts under-reported devices assigned to Addigy sub-policies rather than top-level policies. Device counts in Asset Inventory now match what's visible in the Addigy portal. Partners using Addigy sub-policies may see their device count increase — this reflects accuracy, not a data error.
- Added a new metric for system and agent version.
- Datto RMM
- Fixed an issue where a Datto RMM Parent inspector could report devices belonging to other child tenants when both a Parent and Child inspector were linked to the same environment. Each Datto RMM child environment now shows only its own devices. Partners with both inspectors linked may see their device count decrease — this reflects accuracy, not data loss.
- Auvik
- Fixed an issue where the inspector failed the entire inspection when a tenant's plan tier lacked the "component" capability.
- Autotask
- Fixed broken Parent-Child UI and platform failures introduced by an early PSA overhaul release.
- Barracuda
- Fixed IP Interfaces field mapping on the Firewall inspector, removed the username/password requirement for the Email Gateway Defense inspector in favor of API-key auth, and fixed the Firewall inspector's REST API URL field to accept a space between
https://and the IP address. - Fixed the inspector failing to set up with an "Invalid URL" error.
- Fixed IP Interfaces field mapping on the Firewall inspector, removed the username/password requirement for the Email Gateway Defense inspector in favor of API-key auth, and fixed the Firewall inspector's REST API URL field to accept a space between
- ConnectWise
- Fixed ConnectWise Asio Child Inspectors failing with "Payload size was too large."
- Fixed ConnectWise Manage inspector issues introduced by an early release of inspector changes.
- Fixed numerous UI issues on the ConnectWise integration screen, including table padding, search-icon placement, pagination defaults, duplicate record counts, and toggle/status visibility — also fixed on the matching Hudu and IT Glue screens.
- Cisco Meraki
- Fixed Child Inspectors failing with "Nothing found at peers" on organizations without MX networks, fixed missing IPsec policy data for organization-level VPN peers in hub mode, and fixed an incorrect license expiration date shown in inspector results.
- CrowdStrike
- Fixed an issue that inflated device counts.
- Domotz
- Fixed Child Inspectors failing with a 402 error, and fixed the inspector calling an unavailable endpoint that was breaking customer integrations.
- GoDaddy
- Added visibility into domain auto-renew and billing status, and fixed placeholder text on the CSV API key field.
- HP ProCurve
- Fixed missing model and serial number data.
- Hudu / IT Glue
- Fixed an issue where imported organizations' assigned environments showed as unselected in the assign-environment-group table.
- Fixed an issue where Intune assignment-group display could appear blank.
- Kaseya BMS
- Fixed premature self-discovery of child inspectors that couldn't actually be configured.
- LogicMonitor, Senteon, ThreatLocker
- Added Asset Inventory data landing for these inspectors.
- Managed Printer
- Fixed the CSV export for the SNMP field.
- Microsoft 365
- Fixed 504/500 failures at the mobileApps endpoint on the Parent inspector, fixed a false negative in license-summary alert testing, and fixed intermittent duplication of Enterprise Applications/Service Principals that caused false-positive change detections.
- Added a new metric for user password policies.
- Network Discovery Inspector
- Fixed issues that occurred while processing Asset Inventory data.
- NinjaOne
- Added OAuth 2.0 client-credentials authentication, with the legacy method kept as a fallback.
- ServiceNow
- Fixed a regression where the "Select all domains" filter option was invisible and disabled.
- SonicWall
- Fixed v6 metrics reporting null values after a vendor datapoint change, including alerts triggering with null values due to missing datapoints; fixed v7 Data Print returning dynamically named properties instead of a consistent array structure; and fixed missing licensing information.
- SQL Server Inspector
- Fixed inspector failures caused by exceeding the message size limit on outbound queueing.
- UniFi Cloud
- Fixed the Parent Inspector missing site-level data for single-site/standalone environments, fixed Child Inspectors being discovered as "UniFi Network - Default" instead of their actual site names, and fixed several data-mapping issues across the Child Inspector.
- Device summaries now show additional operating system and OS version detail.
- WithSecure
- Fixed an issue that allowed duplicate launch points to be created.
- 3CX
- Added a new metric for firmware version.
Visual Insights Minor Updates and Bug Fixes
Features
- Roar Designer
- Added clear feedback when a message exceeds the composer character limit, including a live count and guidance to shorten before sending.
- Roar Designer can now inspect an authenticated data source and propose Dataset provisioning (columns, sync settings, and changes) for review and confirmation in chat before applying.
- Dashboards and reporting
- Added optional number overlays on Query Widget bar and line charts, with configurable value columns, reducers, placement, sizing, and labels.
- Bar and line charts now accept a single column or a list of columns for the Y series, with series labels via
columnLabelsand clearer validation for invalid series shapes. - Added Query Widget Quick Controls — a second editor tab beside Definition YAML for common display settings (axis titles, bar orientation/gap, area fill, and paths Roar Designer marks as editable) — with live preview.
Improvements
- YAML autocomplete for Query Datasets and Query Widgets is more reliable on Linux (including Ctrl+Space with an IME), with stronger context-aware suggestions while typing.
- First and last name are now required when creating or saving a user, with clearer validation so profile saves (including avatar changes) aren't blocked by a hidden name error.
- Cleaned up the dashboard folder dialog layout (no nested card), with better spacing between the folder field and Save/Close.
- Roar Designer branding now appears consistently across remaining UI labels (navbar, chat, settings, and related surfaces) instead of mixed assistant names.
- Widgets now show a clearer Filtering/Refreshing activity indicator while data updates, and keep prior results visible until new data arrives.
Bug Fixes
- After Roar Designer writes Definition Files, open dashboards stay in view mode instead of flipping into edit/configuration mode.
- Fixed Query Widget column links losing connection-variable slots (
{{ conn.* }}) and row interpolations when copied from Datasets; omitted links can now inherit from source templates. - Drilldown display maps (
columnLabels,columnDefs,pinnedColumns) now validate against Widget Query and drilldown schemas; Roar Designer writes get earlier preview feedback and require a drilldown query when authoring widgets. - Fixed dashboards crashing on invalid or zero sync timestamps, and when opening a drilldown after a widget is missing.
- Dashboard filters are now isolated per browser tab, so exploring filters in one tab no longer overwrites another.
- Filter Variables can now load columns from live (non-materialized) Query Datasets, with loading and error states when schema resolution fails.
- Fixed Table Query Widget drilldowns accepting unsupported click-value placeholders; behavior now aligns with footer-expand drilldowns.
- Classic widget drilldown Excel/CSV exports now use the same friendly column aliases shown in the UI instead of raw field names.
- Hardened null/missing-data handling in grid scroll, data-modifier preview, and related dashboard UI paths to prevent intermittent crashes.
- Fixed SQL workspace and categorical query crashes that could abort Query Dataset analysis, including all-null categorical groupings and multi-source wildcards.
- Modified-dataset tool failures from underlying data-engine panics now surface as normal tool errors instead of hard failures.
- Fixed share-link dashboard filters leaving widgets spinning indefinitely; shared Query Widgets now refresh correctly after filter changes.
- Fixed share-link Query Widget drilldowns failing to resolve sources by Definition Slug (and related identifiers), so drilldowns now work when the saved source is a slug rather than only a UUID or display name.
- Shared dashboards now refresh widgets immediately after Filter Variable changes (including unique-browser share selections), without requiring a full page reload.
- Hardened Query Widget writes and column-link inheritance (transaction-safe previews, alias-aware links, omitting inherited links when required columns aren't selected).
- Roar Designer now only surfaces tools and guidance for capabilities available in the deployment, so unavailable optional product areas aren't offered.
- Transient assistant provider failures (connection, timeout, rate limit, temporary server errors) now recover automatically, with reconnect status and clearer progress messaging.
- ConnectWise: Project tickets can now be enriched with the latest resolution note (and a related "has resolution note" indicator) when resolution columns are selected.
- ConnectWise: Project ticket resolution notes now use a valid note ordering field, so enrichment requests succeed reliably.
- Fixed an intermittent loading timeout on password-protected Visual Insights dashboard links.
Updated 20 days ago