Go Back in Time with Liongard
Use Liongard's timeline to quickly gain situational awareness when an issue arises
Liongard takes continuous snapshots of your customers' Environments and identifies configuration changes in the Liongard timeline. This timeline will show you exactly what changed and when.
Liongard's timeline can be valuable any time there is an issue with a customer system. For example, if something breaks, a mysterious issue has surfaced, or you need to do a root cause analysis.
Liongard Academy: Troubleshoot Customer Issues Faster CourseIn addition to our documentation, take our "Troubleshoot Customer Issues Faster" course in Liongard Academy!
View the Timeline for One System
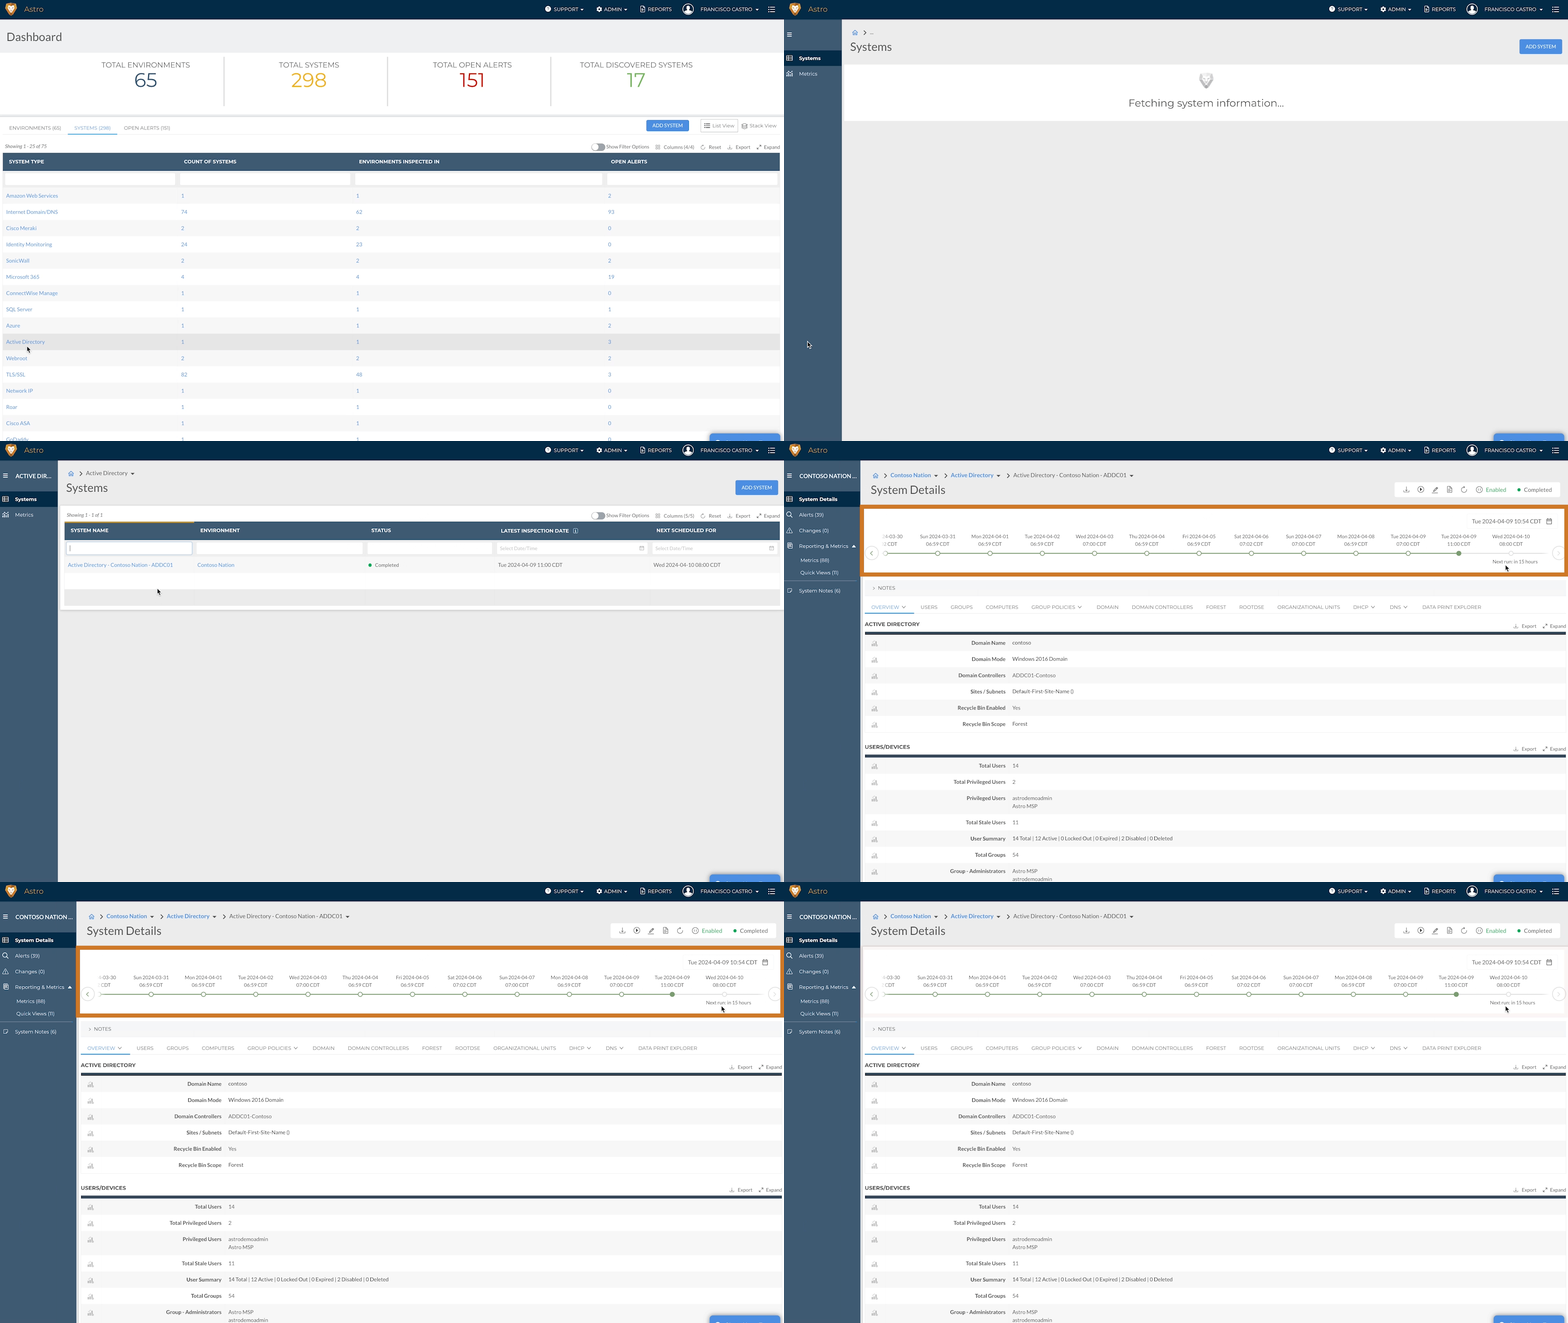
After you log in to Liongard, navigate to Systems > Click into an Inspector
Here, you'll be able to see the timeline for that Environment's System Inspector.

View Historical Data
When you click on a point in time in the past, Liongard will update all of the data views in the tabs below to reflect the system configuration and status details at that point in time.

Liongard takes snapshots of systems every 24 hours by default and can store them in Liongard for a year.
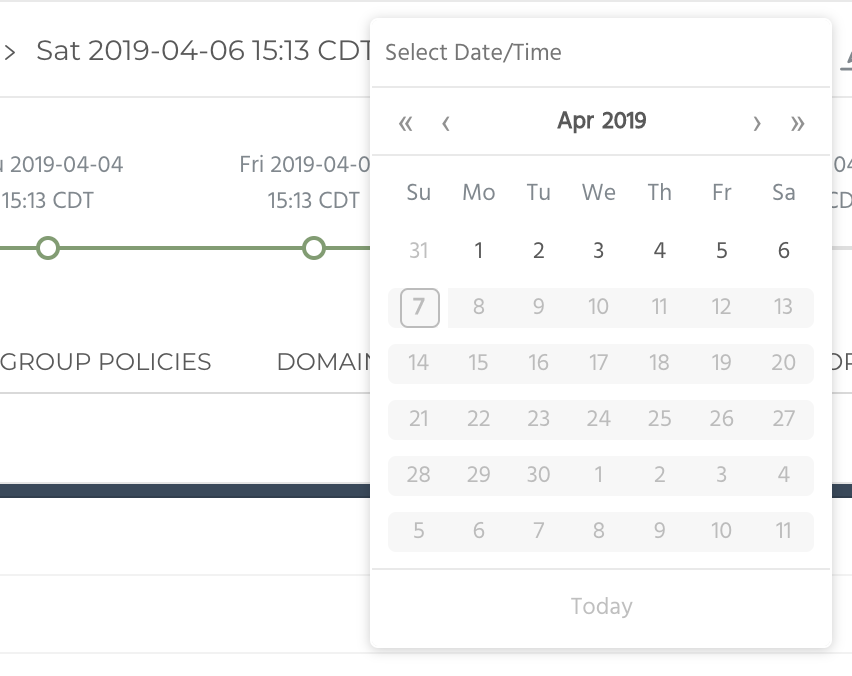
To jump back farther to a specific point in time, click on the calendar icon in the breadcrumb.
This will allow you to select a day in the past to view. The data collection starts the first day you set up the Inspector.

View Critical Changes
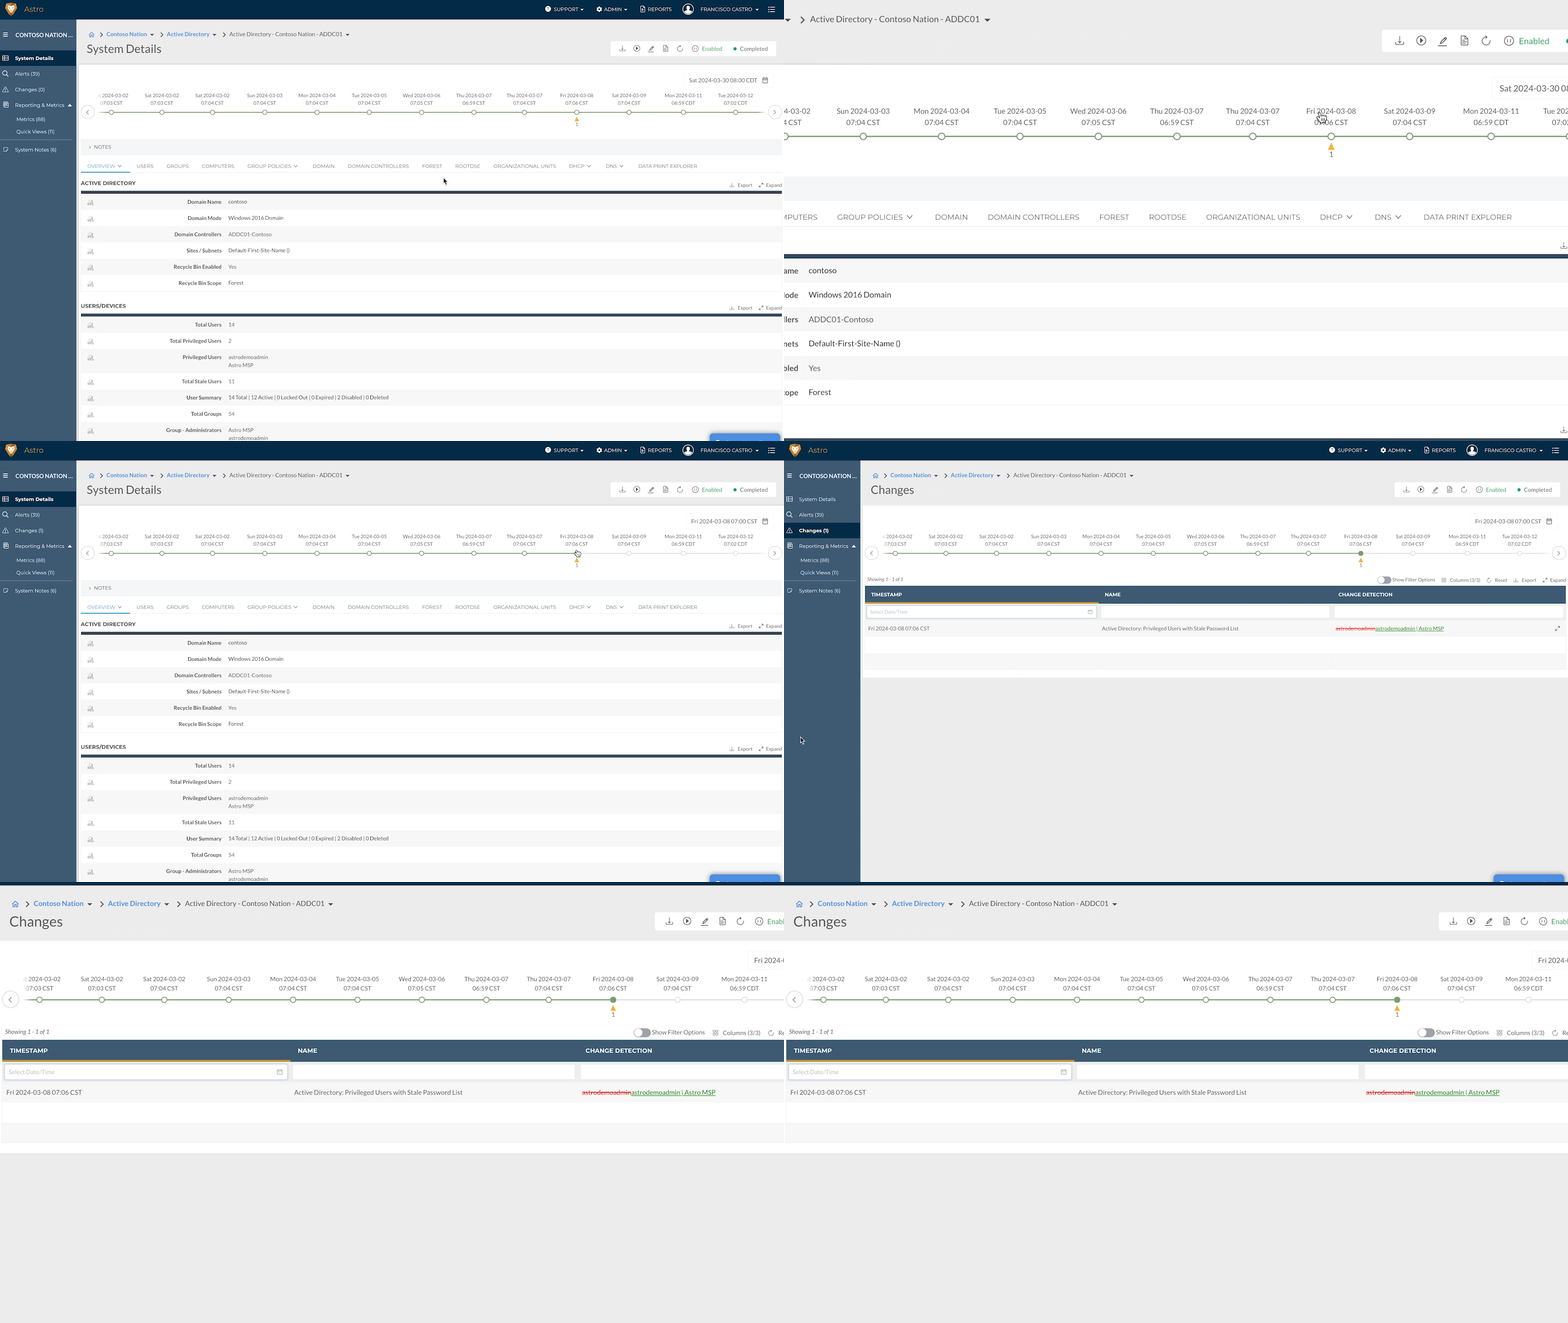
If a critical change occurs, you will see a yellow delta on the timeline with the number of changes listed below.
To view the change(s), **Click on that point in the timeline > then the "Changes" tab on the left hand side to see what changed.
To learn more about our Change Detections, please review our Change Detections documentation.

Once you click into the Changes tab, Liongard will give you basic information about what changed.
In the above example, we can see that "Kevin Mitnick" was added as an Active User. We know he was the user who changed because his name is listed in green. Using this context, we can then navigate to the "Users" tab to learn more. Additionally, another change was capture about the Active Directory System being modified. We can see that there was a change from total users from 10 to 11, leading to a change in Active Users from eight to nine. Again, clicking into the "Users" tab on the Dashboard can give us more information.
Add Human Intelligence to Automation
Users have the ability to add human intelligence to Liongard's automation with our Notes feature. Notes are short text snippets that can be added to an Environment or a System in Liongard.
System-level notes can be tagged to a timeline entry to add more context to an inspection.

Partial Data Icon
A blue diamond icon will appear on the Timeline when data in the Data Print returns a "NoDataReturned" value. When a data point is marked as "NoDataReturned," that data point will not be evaluated in the Metrics process. This will ensure Change Detections are only processed for valid data points.
Currently, this functionality is only applied to the Internet Domain/DNS Inspector and the Cisco Meraki Inspector. It may be applied to additional data points in the future.
Updated 7 months ago
