Visual Insights Pro
Overview
Visual Insights Pro is a premium add-on that provides automated, reliable, and highly customizable dashboards powered by the ConnectWise, Excel,Autotask, HaloPSA, and QuickBooks connectors. You can create, personalize, and export dashboards using your own branding, ensuring a consistent and trusted experience for both internal use and client communications. Real-time, unified datasets and intelligent data callbacks enhance data integrity and remove reporting complexity, allowing operational, financial, and executive teams to make faster, more informed decisions.
Excel Connector
The Excel Connector for Visual Insights allows you to securely connect Excel files stored in Microsoft OneDrive or SharePoint and use them as data sources within Visual Insights dashboards and reports.
This connector is ideal for incorporating custom spreadsheets, financial models, operational tracking sheets, or any data maintained outside integrated PSA or RMM systems.
Key Capabilities
- Connect directly to Excel files hosted in OneDrive or SharePoint
- Use Excel data as a live data source for dashboards and visualizations
- Combine Excel data with other Visual Insights connectors for richer reporting
- Automatically refresh data to reflect updates made in Excel
Requirements
- A Microsoft account with access to OneDrive or SharePoint
- Permission to the Excel file you want to connect
- Excel files must be stored in OneDrive or SharePoint (local files are not supported)
Supported File Locations
- Microsoft OneDrive
- Microsoft SharePoint
QuickBooks Connector (QBs Online Only)
The QuickBooks (online) integration with Visual Insights provides real-time access to your financial data, enabling deeper visibility into revenue, expenses, and overall financial performance—all within a single reporting platform.
By connecting QuickBooks to Visual Insights, you can seamlessly ingest financial data and transform it into interactive dashboards and reports without the need for manual exports or complex data preparation. This integration keeps financial insights current, ensuring decisions are based on the most up-to-date information available.
Key Capabilities
- Real-Time Financial Data Access
Automatically sync financial data from QuickBooks to Visual Insights, ensuring dashboards and reports reflect the latest updates. - Comprehensive Financial Visibility
Analyze key financial metrics such as income, expenses, profit and loss, and cash flow across customizable dashboards. - Centralized Reporting
Combine QuickBooks financial data with operational and business data from other integrations for a unified reporting experience. - Client-Ready Dashboards
Create professional, branded financial reports suitable for internal stakeholders or client-facing presentations.
Autotask Connector
The Autotask connector for Visual Insights Pro allows you to sync your Autotask PSA data into a powerful analytics and reporting environment.
Once connected, your data automatically syncs across more than 15 supported datasets, including Companies, Contacts, Configuration Items, Contracts, Contract Milestones, Contract Rates, Contract Service Bundles, Contract Services, Invoices, Products, Projects, Resources, Service Calls, Tasks, Tickets, and Time Entries. This continuous synchronization ensures you always have up-to-date information available for reporting and analysis.
We currently have 4 out-of-the-box dashboards ready for you to use.
Autotask Ticket Dashboard
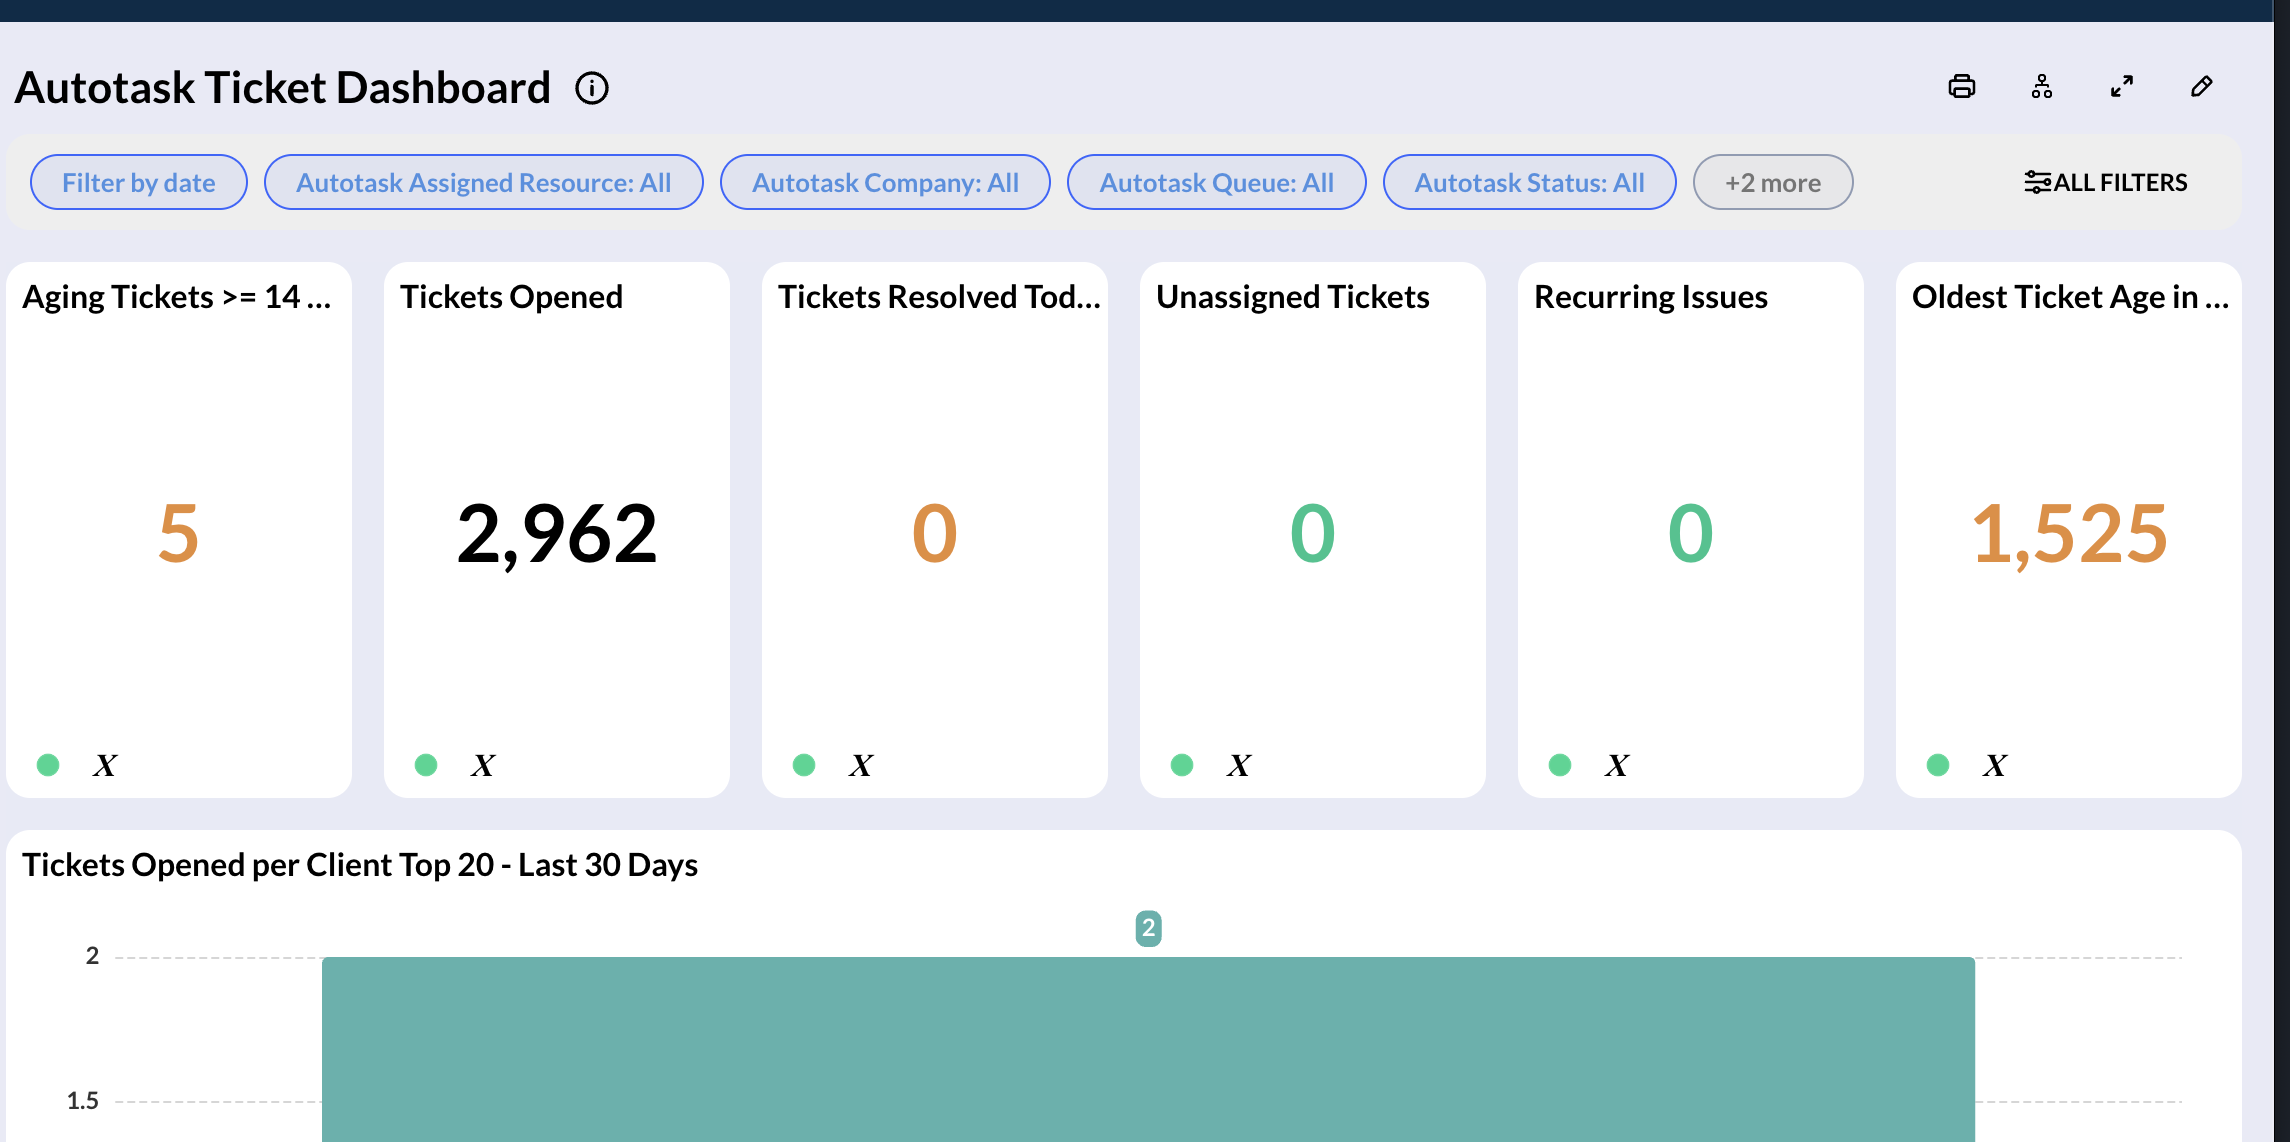
The Autotask Ticket Dashboard provides near real-time visibility into service desk activity, helping you monitor ticket volume, technician performance, and client demand.
It includes KPI summary cards for key metrics like aging tickets, unassigned work, and daily activity, along with visualizations that highlight top ticket-generating clients, weekly ticket trends, and end-user activity. The dashboard also surfaces technician performance through a resource scorecard and flags tickets that have remained in progress for too long. Additionally, near real-time views—such as tickets opened in the last 15 minutes—help you stay on top of incoming demand as it happens.
Autotask Frontline Ticket Status
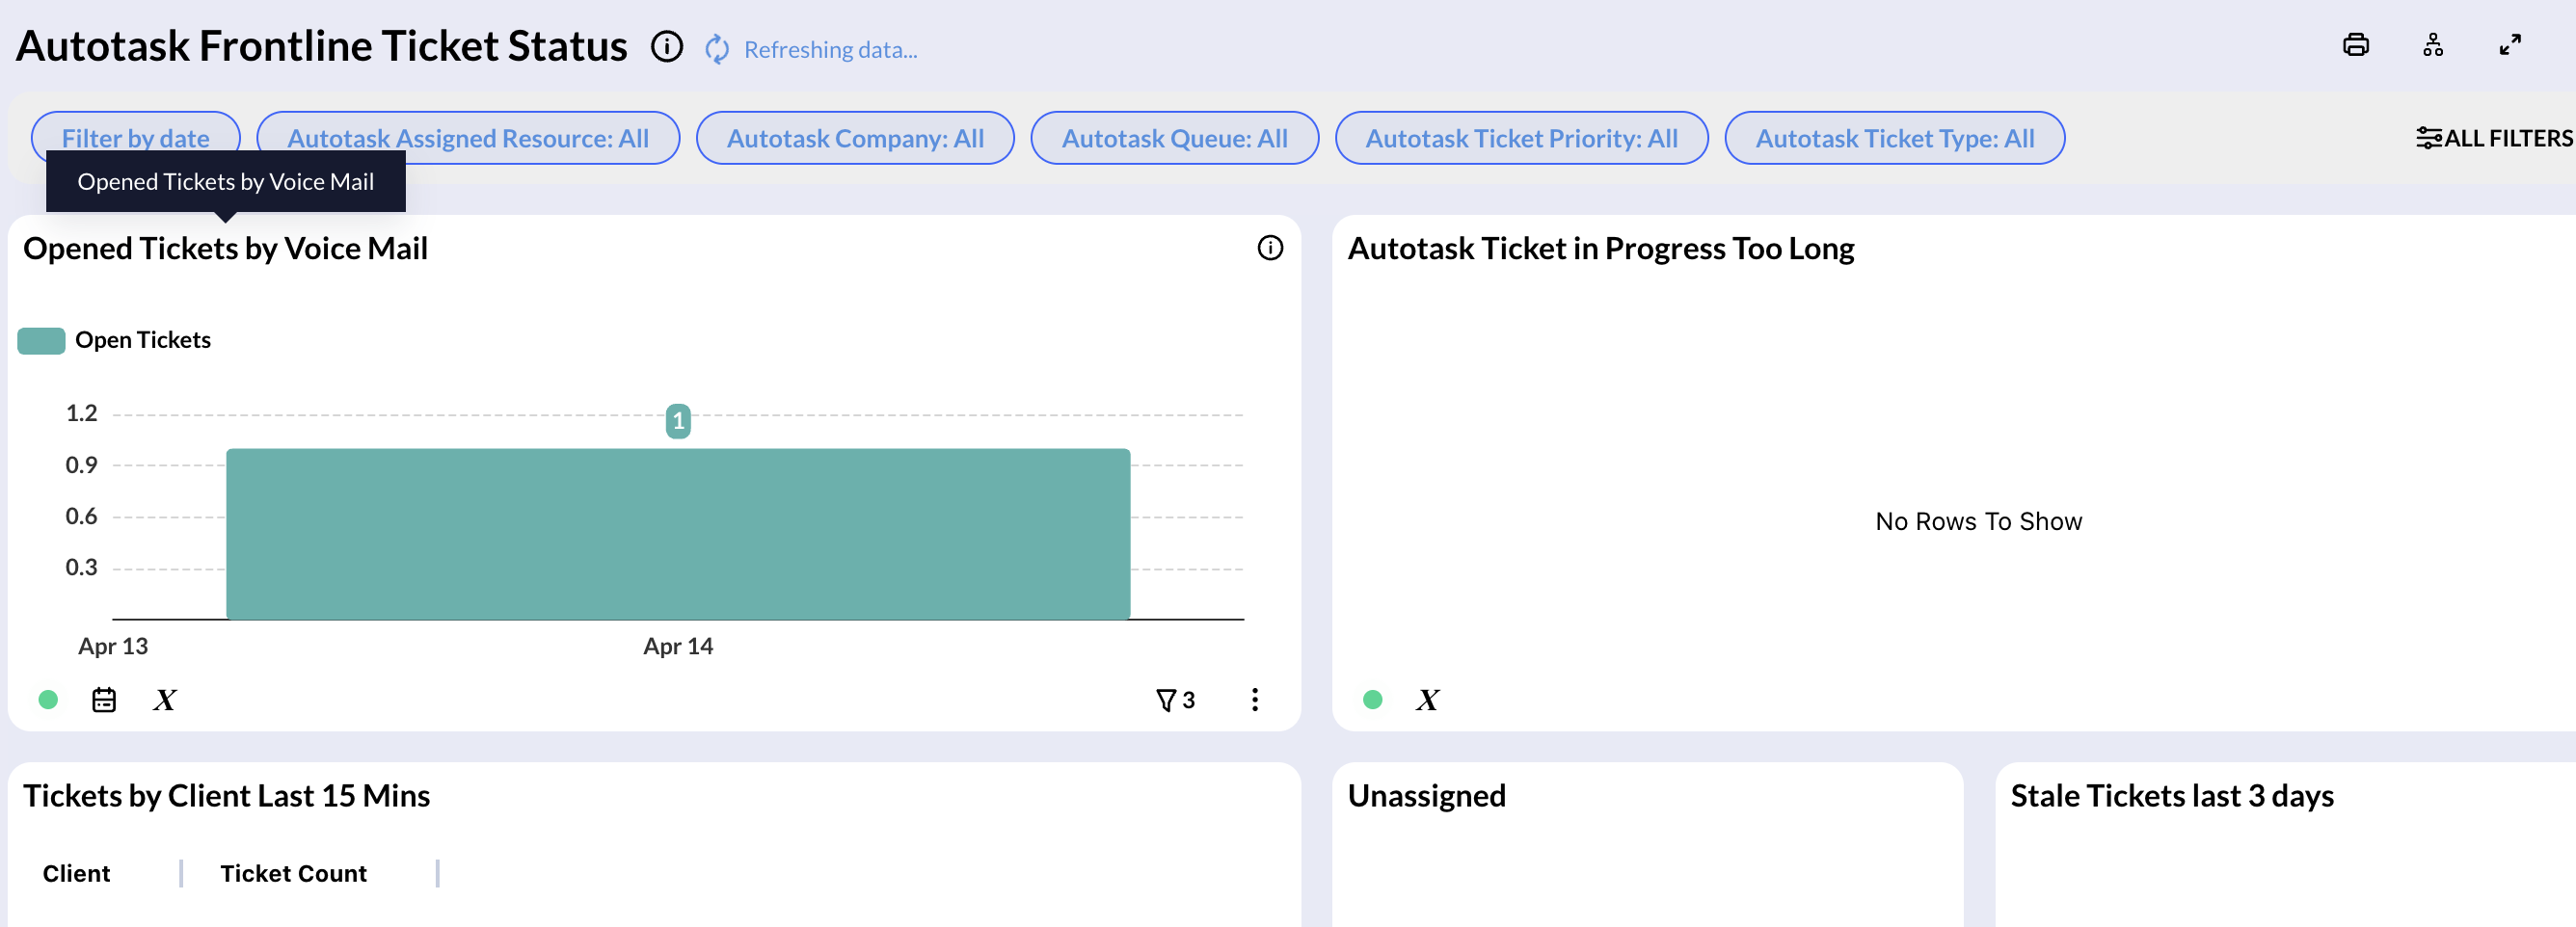
The Autotask Frontline Ticket Status Dashboard provides a near real-time view of service desk activity, helping you monitor ticket flow, technician performance, and operational bottlenecks. It highlights key metrics such as ticket intake trends, unassigned and stale tickets, and tickets in progress beyond expected thresholds. You can also track recent client activity, including tickets opened in the last 15 minutes, and review voicemail-generated tickets over time.
The dashboard includes a resource scorecard to evaluate technician workload and productivity, alongside weekly ticket volume insights to help you understand demand and performance at a glance.
Autotask Technician Performance
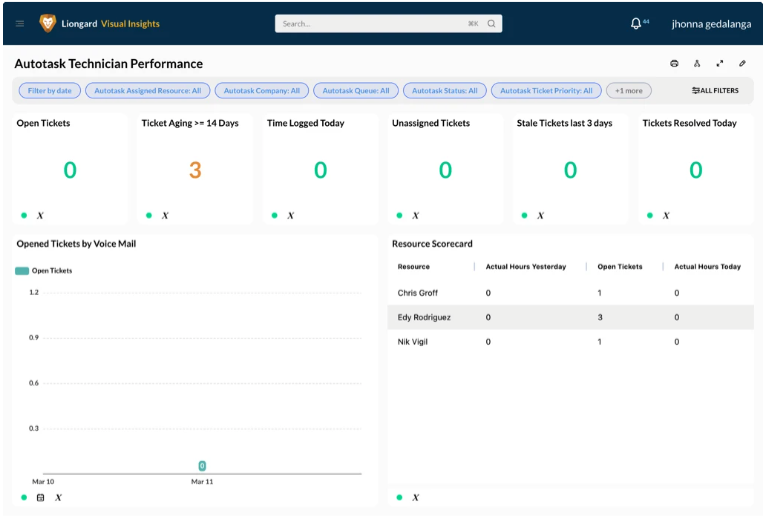
The Autotask Technician Performance Dashboard provides a focused view of technician productivity and ticket activity through key KPIs, voicemail-driven ticket trends, and a detailed resource scorecard—helping you track workload, performance, and ticket management efficiency at both the team and individual level.
Autotask Top Ticket Makers
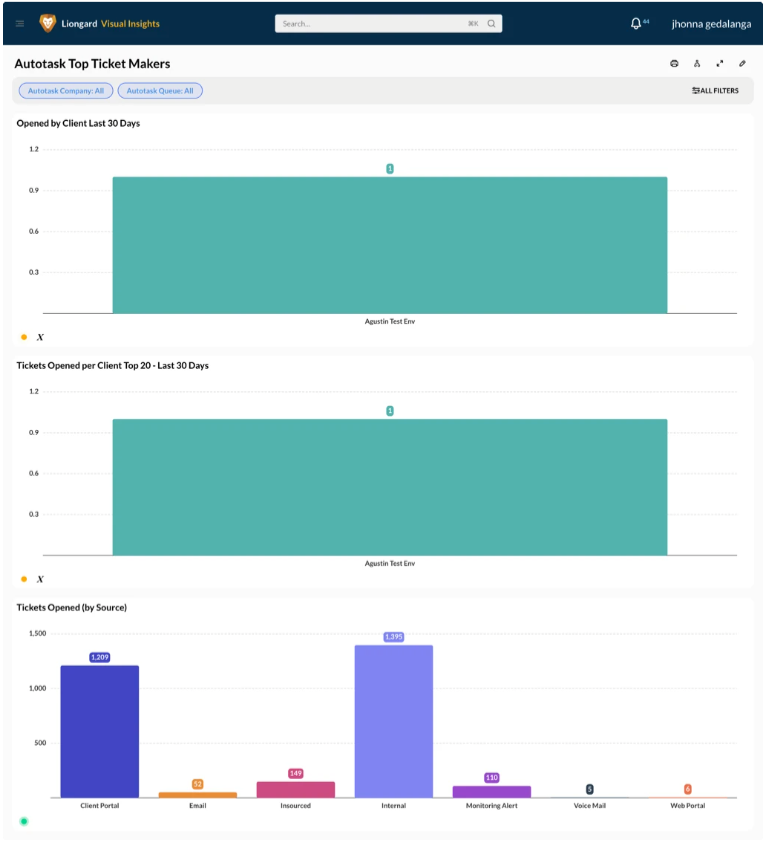
The Autotask Top Ticket Makers Dashboard provides a clear view of ticket demand by highlighting which clients generate the most tickets over the last 30 days. It also breaks down ticket volume by source, helping you understand where requests are coming from and identify trends in client activity.
HaloPSA
The HaloPSA integration syncs multiple types of data into the platform, including:
- Service desk data such as tickets, notes, teams, and SLA targets
- CRM data including clients, sites, and contact history
- Asset data like configuration items and asset fields
- Project data such as project status, milestones, and task completion
- Financial data including invoices and charge rates
ConnectWise Connector
Visual Insights Pro seamlessly integrates with ConnectWise to deliver powerful, real-time dashboards backed by advanced customization options. Partners benefit from a unified data experience and the ability to create visually branded, highly professional reports and dashboards for internal teams or end clients.
Feature Highlights
- Out-of-the-box integration with ConnectWise (secure and rapid setup)
- Near real-time data sync (checks new/updated data every minute)
- Unified ticket dataset—no more complex joins between service and project tickets
- Callback-driven data integrity—including notifications for deletions and non-standard data changes
- 7 out-of-the-box Dashboards available in the Template Gallery
- Advanced customizable branding, including logos, color schemes, and export-ready templates for client-facing output
Visual Insights Pro ConnectWise integration includes seven customizable, brandable dashboards that provide insights into performance, productivity, and customer experience:
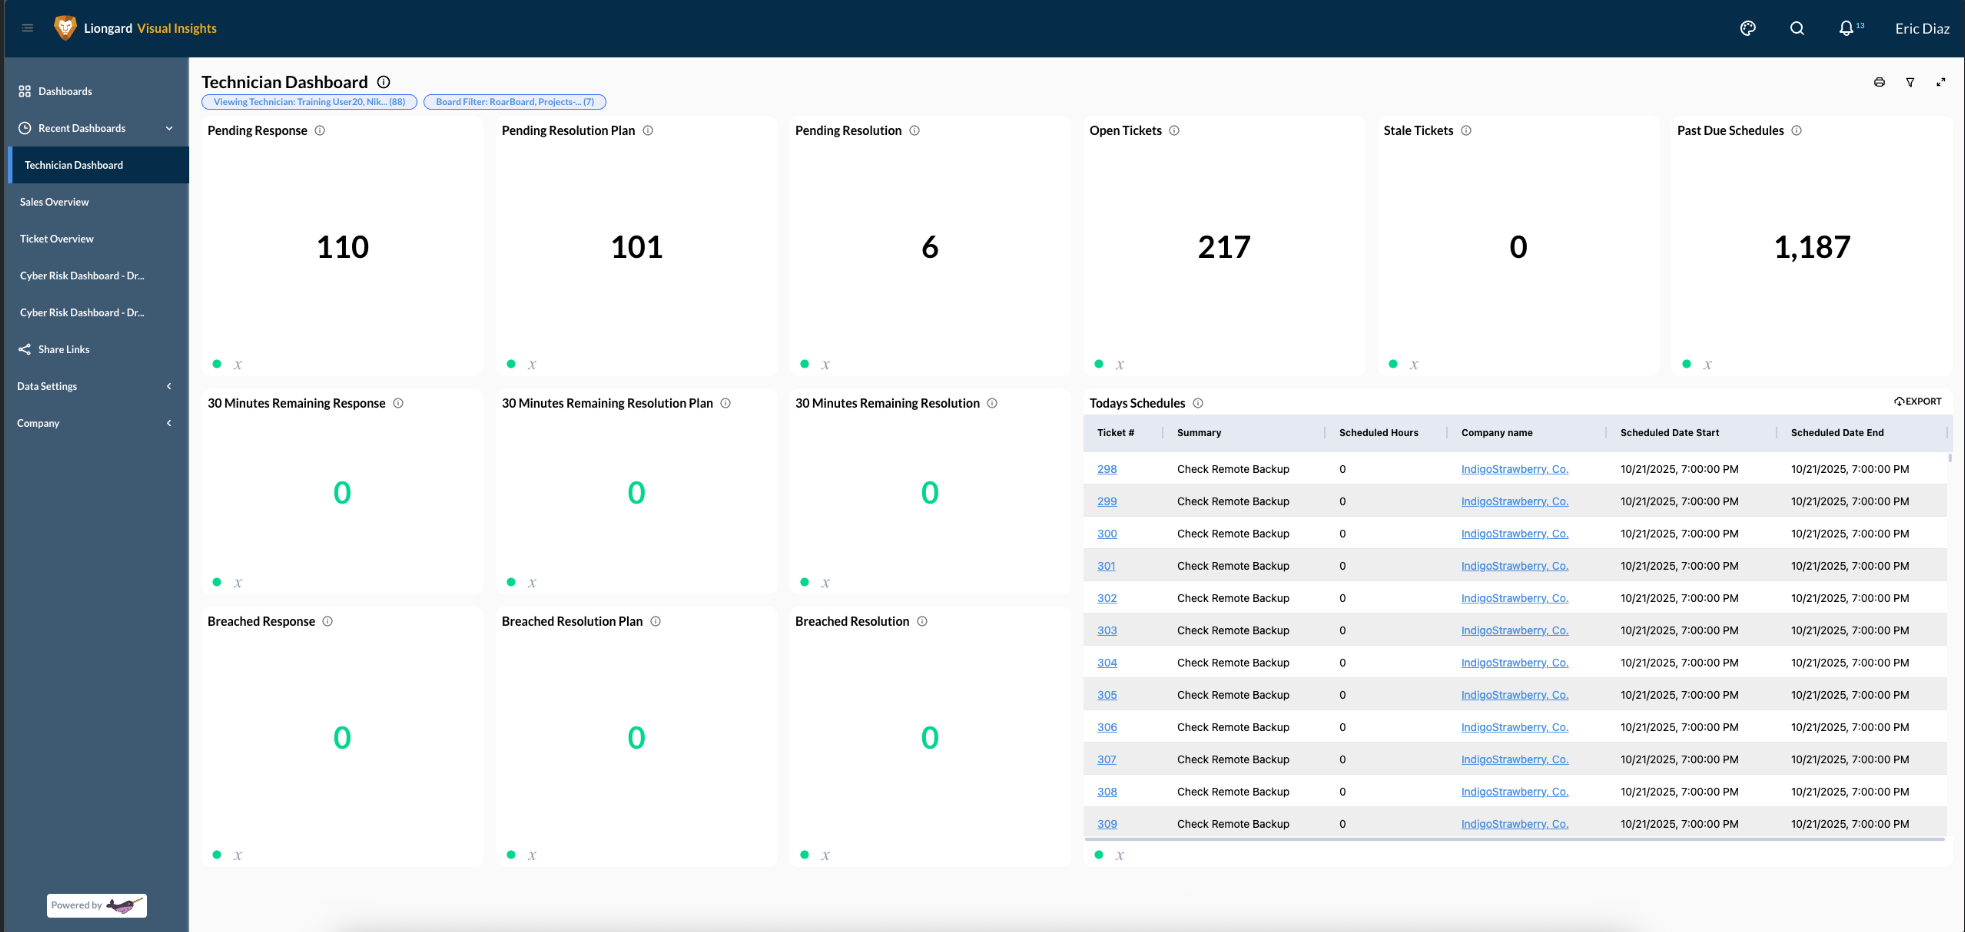
Technician Dashboard
A dashboard that technicians use to view all their assigned tickets and schedules. Tech leads can create filtered outputs and share links for each technician to monitor their individual queues.
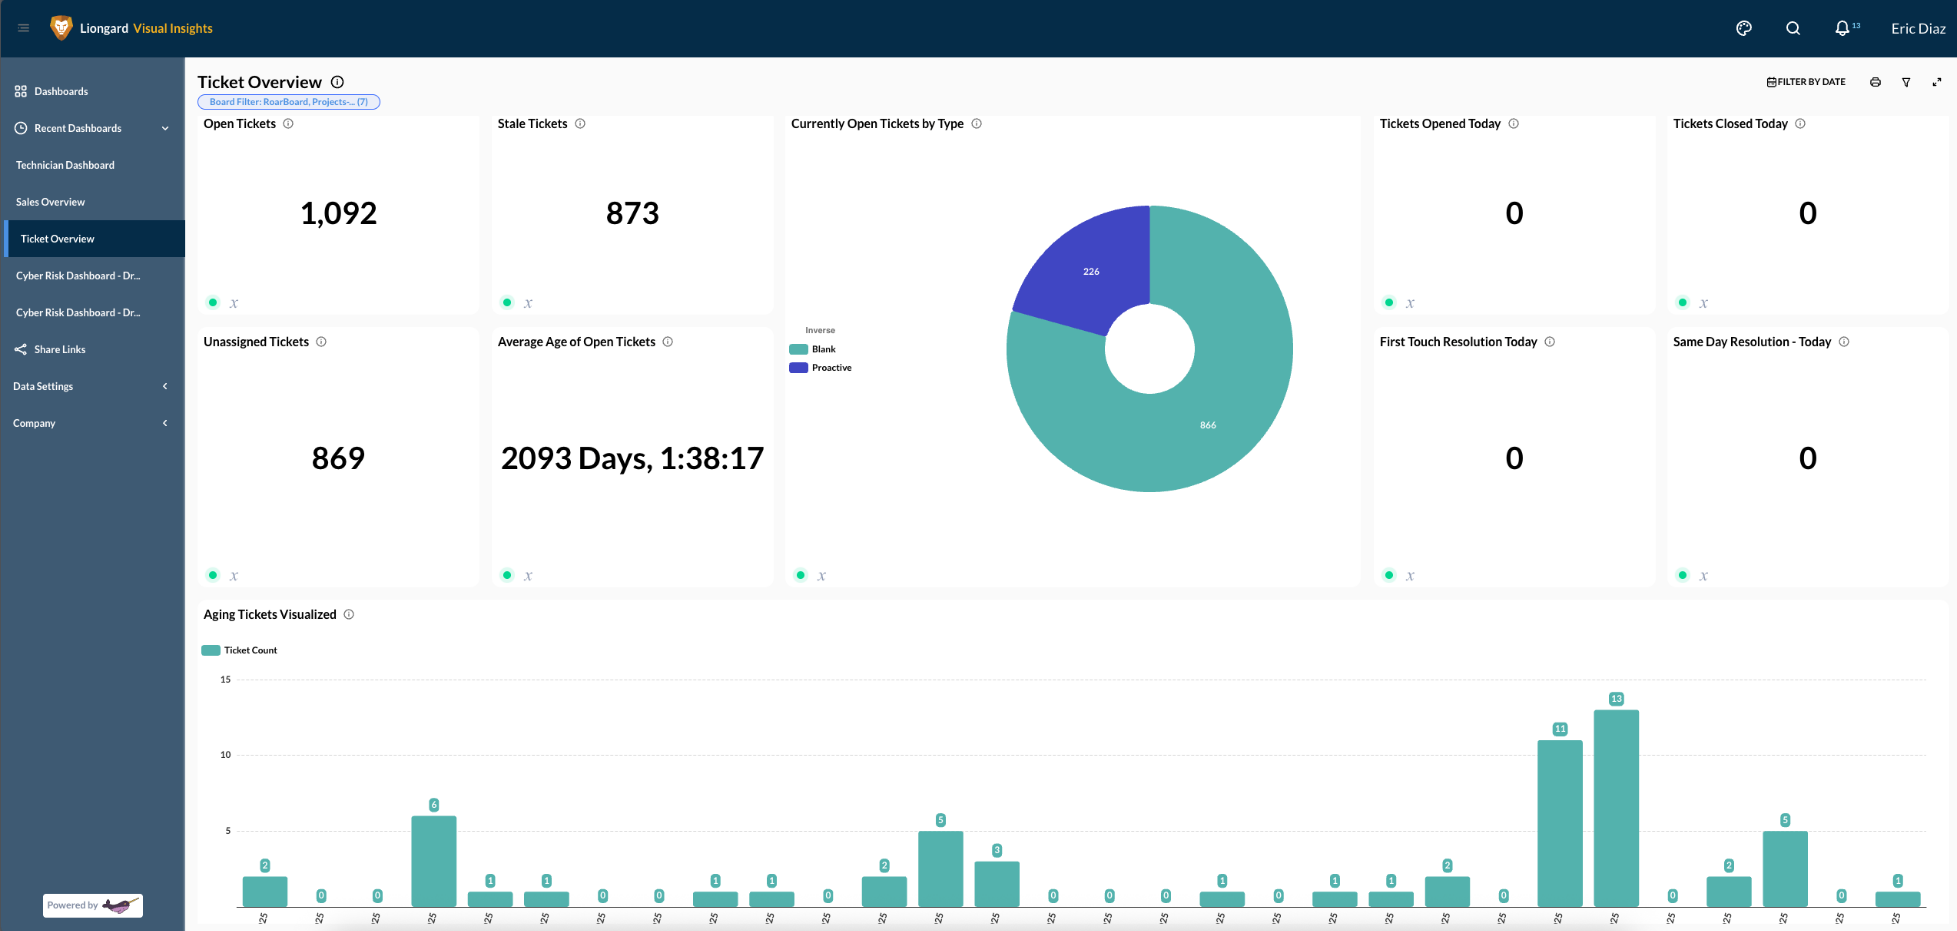
Ticket Overview
A dashboard used by a lead or pod manager to view all tickets entering and exiting the organization.
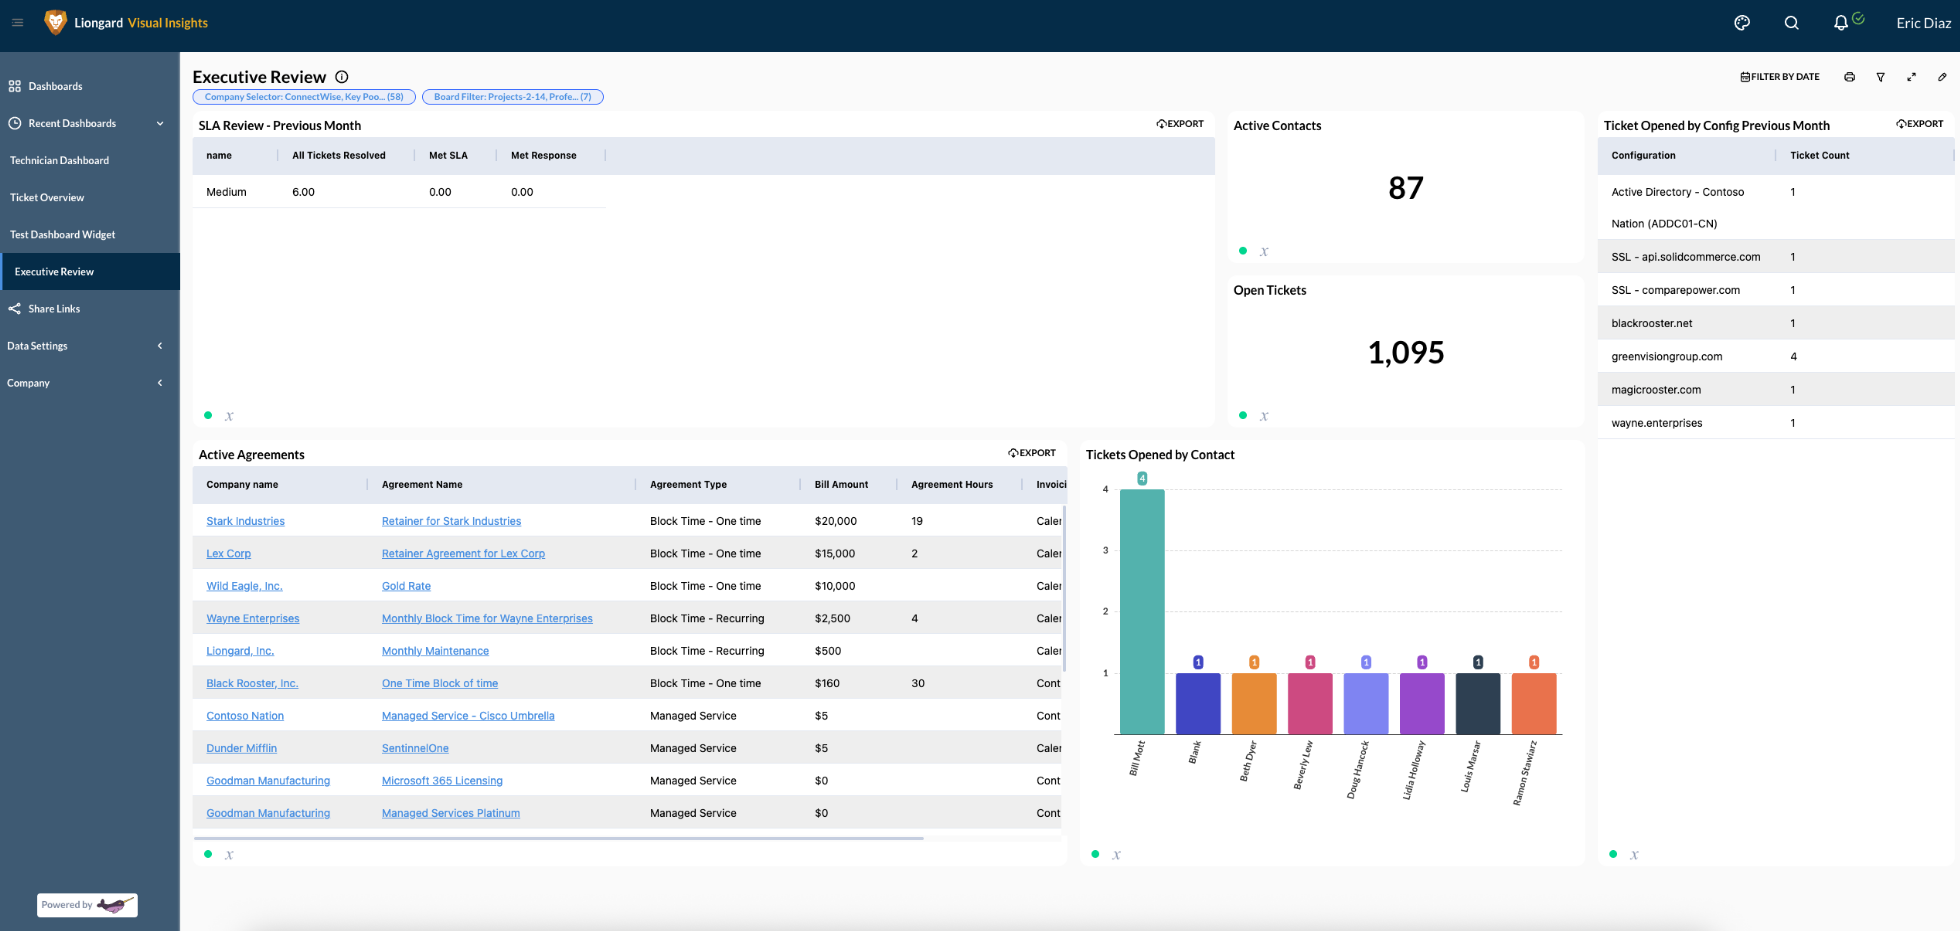
Executive Review
Prepare for client reviews by utilizing SLA metrics, highlighting key configurations, and applying dynamic client filters.
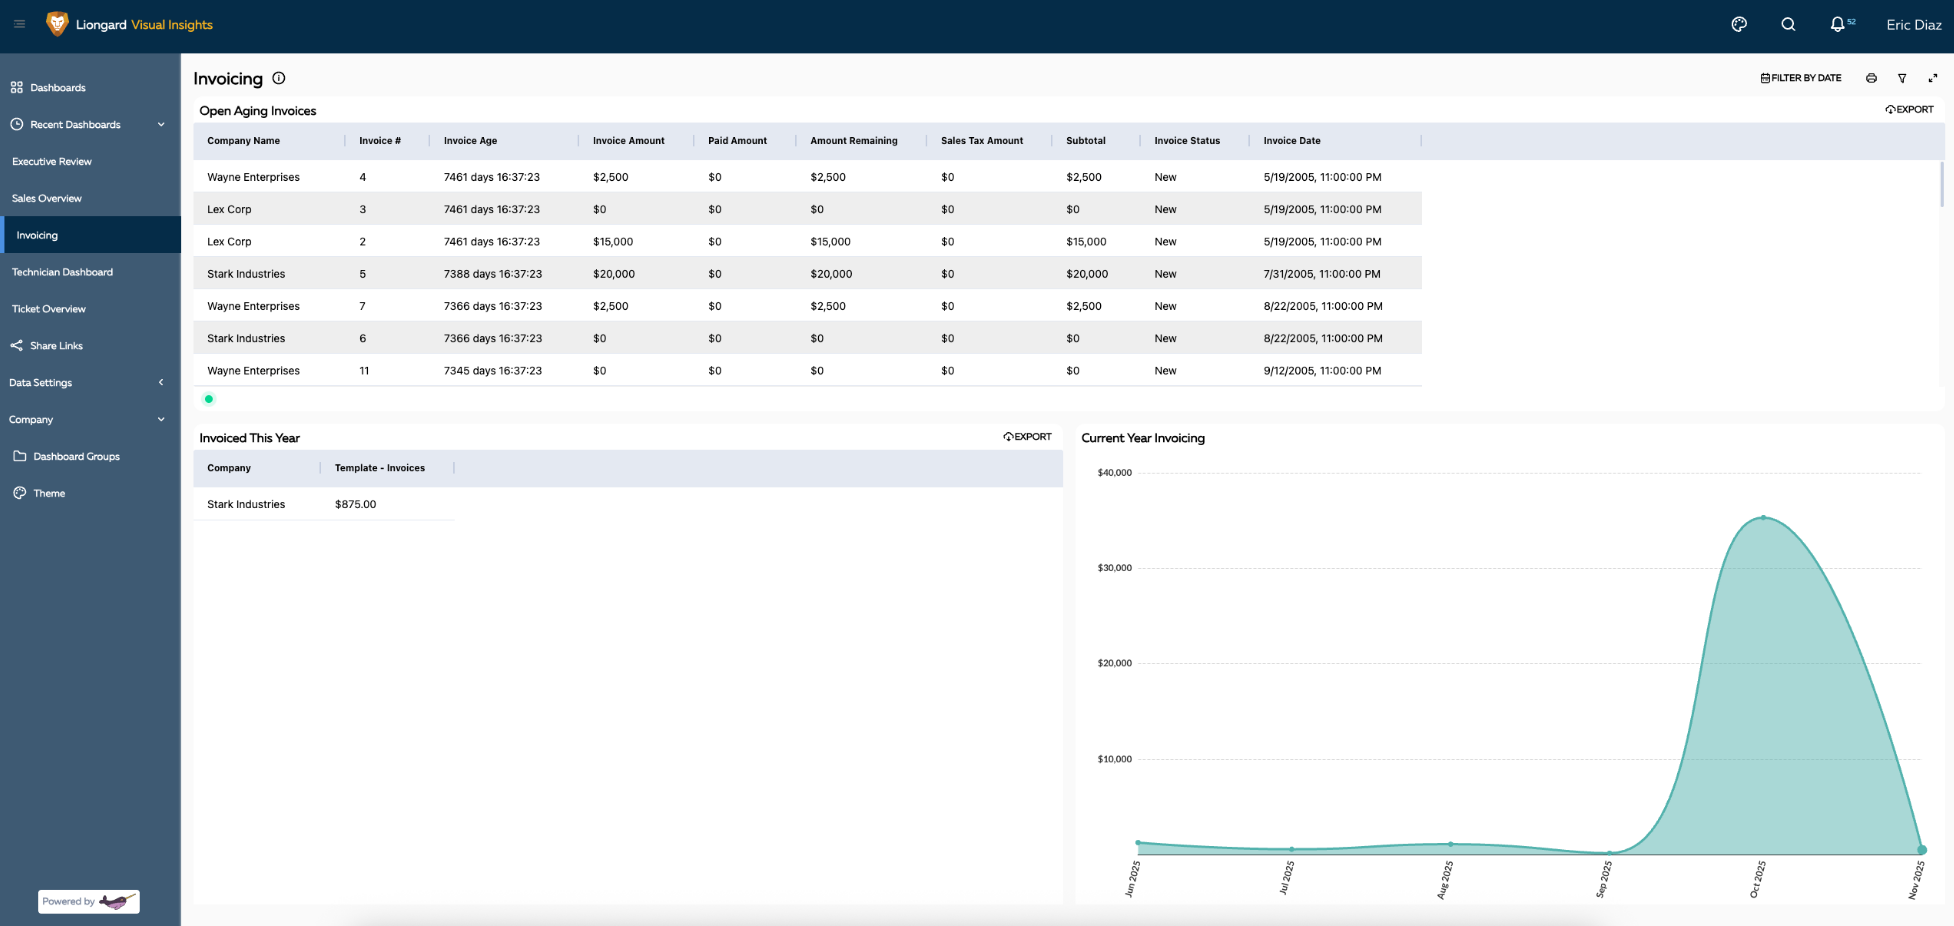
Invoicing Overview
Quickly assess invoice aging and monthly billing trends to enhance financial oversight.
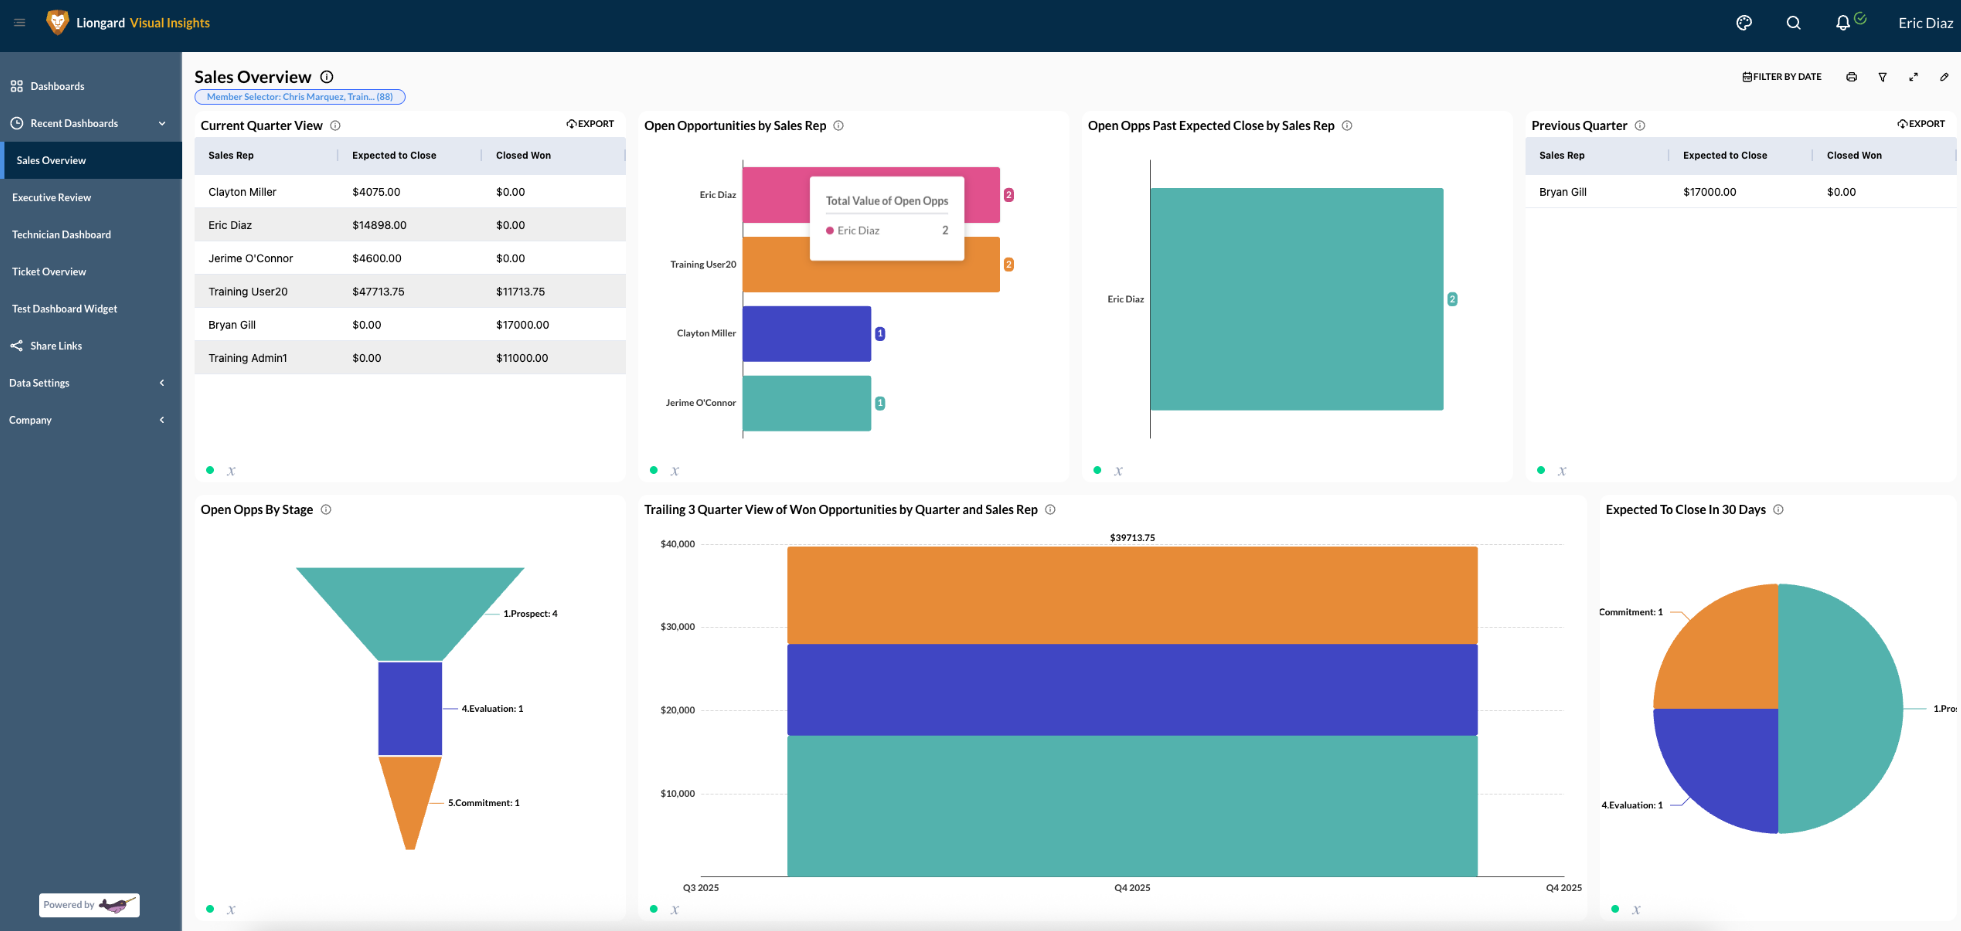
Sales Overview
Gain up-to-date visibility into pipeline performance, revenue by representative, and overdue opportunities.
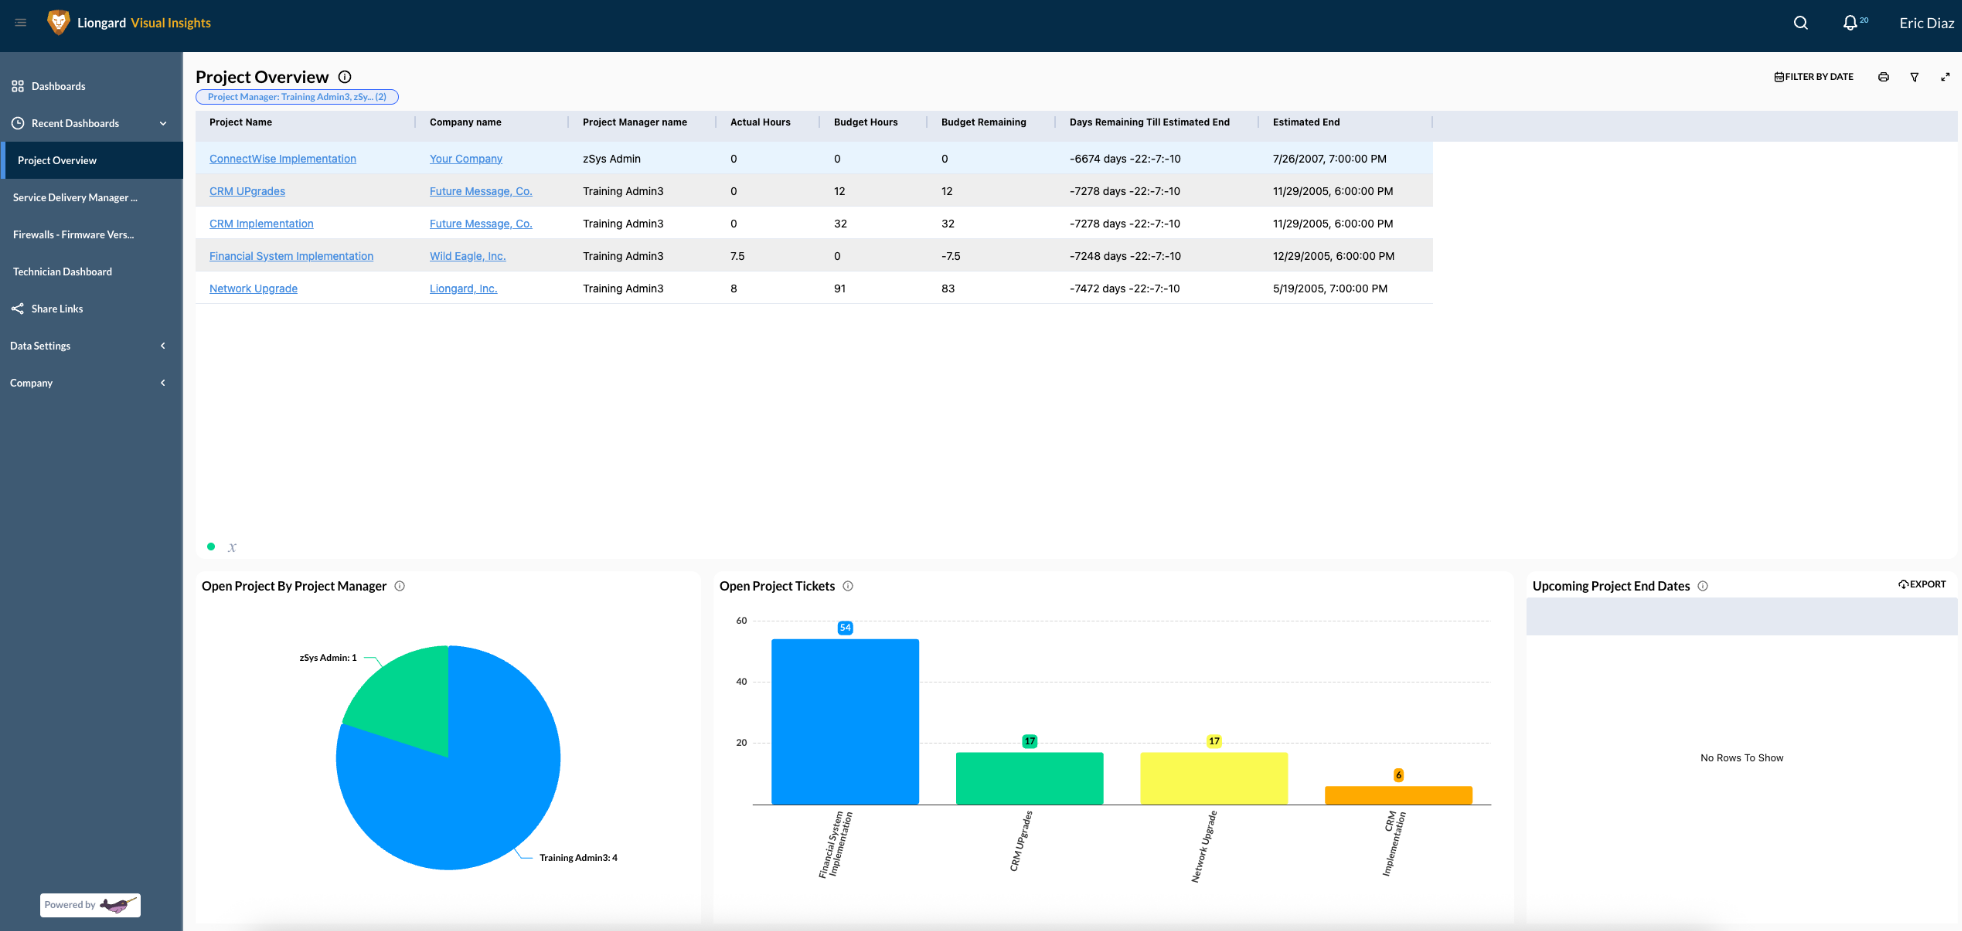
Project Overview
View open projects, budgets, and workloads by project manager to stay ahead of timelines.
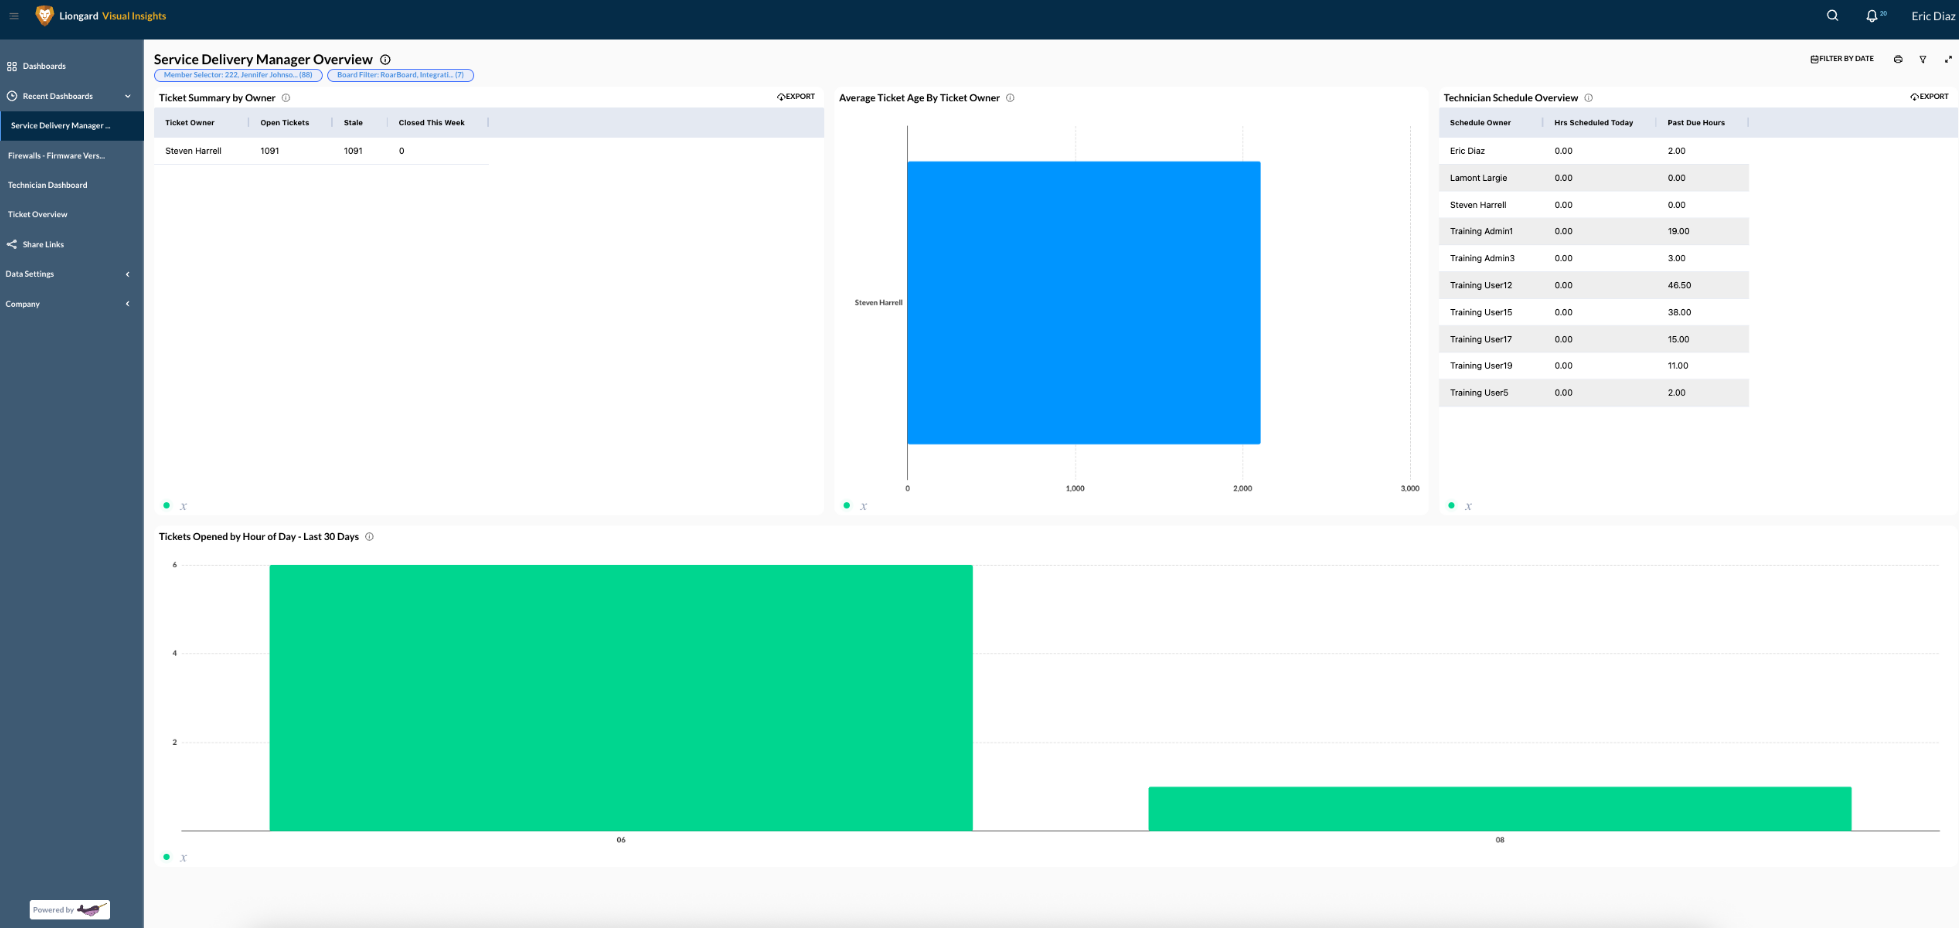
Service Delivery Manager Overview
Monitor team workload, ticket aging, and SLA health to ensure delivery stays on track.
Customized Branding Options
You can customize the chart colors and overall appearance using the Themes option. This allows you to fully personalize your portal and create a truly branded experience. You can select custom colors, change the header text from Liongard to your company's name, and update the subheader to any other preferred label. With extensive color and styling options for buttons, text, and more, you can make the portal perfectly reflect your brand identity.
Don’t see what you need?
If you’re looking for a connector or dashboard that isn’t available yet, reach out to your Account Manager. We’re always adding new integrations based on partner feedback.
Updated 3 months ago