How to Digest Liongard's Data
Overview
Purpose: Learn how to navigate and digest Liongard's Data Audience: Team members who will be digesting Liongard's Data in Liongard
Train your team on how to:
- Navigate in Liongard to access your Clients' Data
- Find and Read Liongard's Change Detections
- Use Liongard's Data
Navigating Liongard
Dashboard Screen
Your Liongard Dashboard Screen allows you to digest Liongard's data.
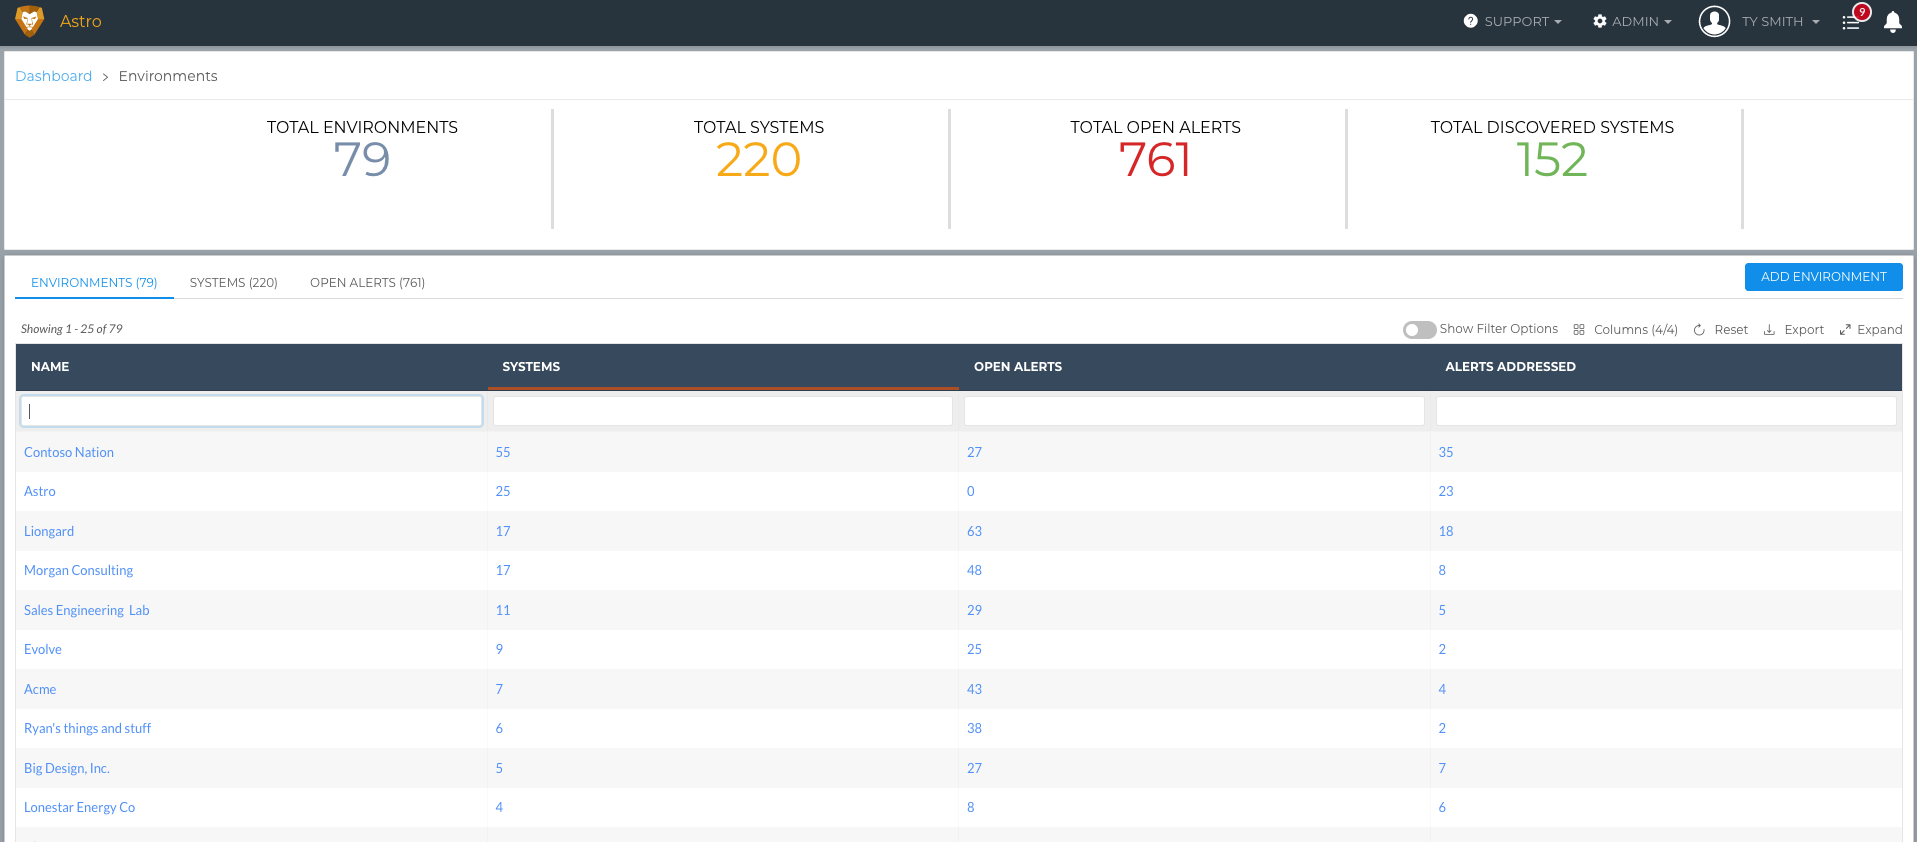
There are two tabs on the Dashboard Screen that will be helpful in accessing your client's data:
The Environments Tab
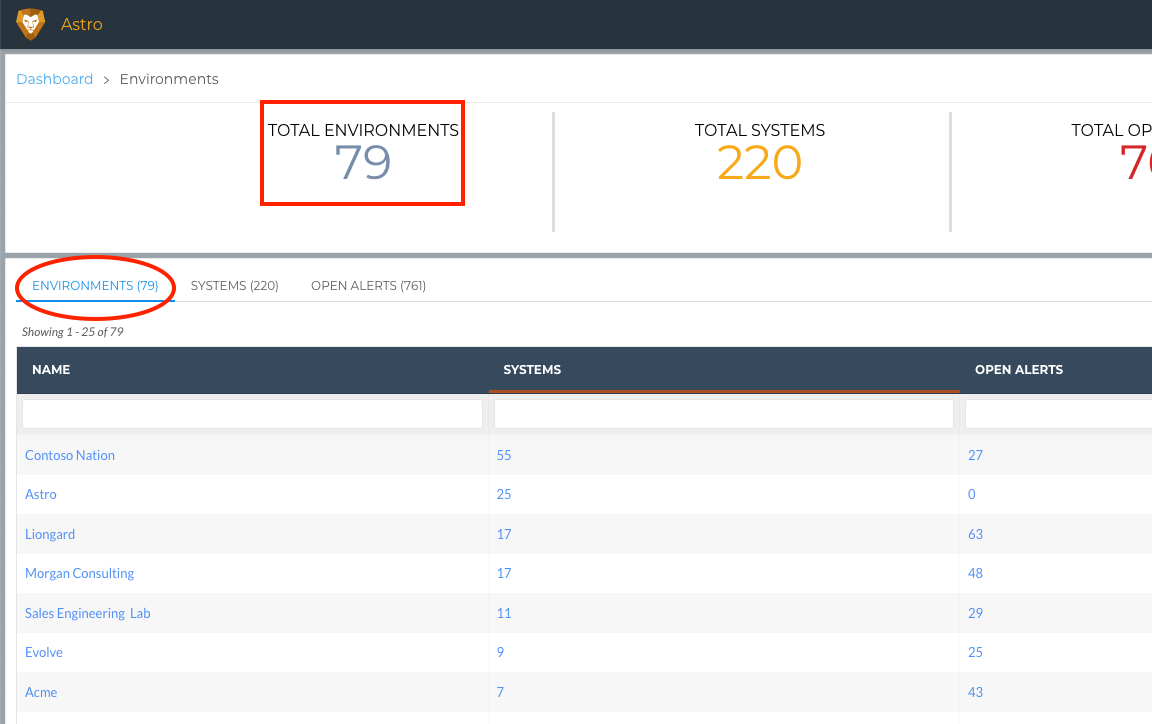
This tab will display a table with a list of all of your Environments in Liongard. Here you'll find:
- Name of the Environment
- The number of Systems (System Inspectors) that have been rolled out for the associated Environment
- The number of Open Alerts for the associated Environment
- The number of Alerts Addressed for the associated Environment
The Systems Tab
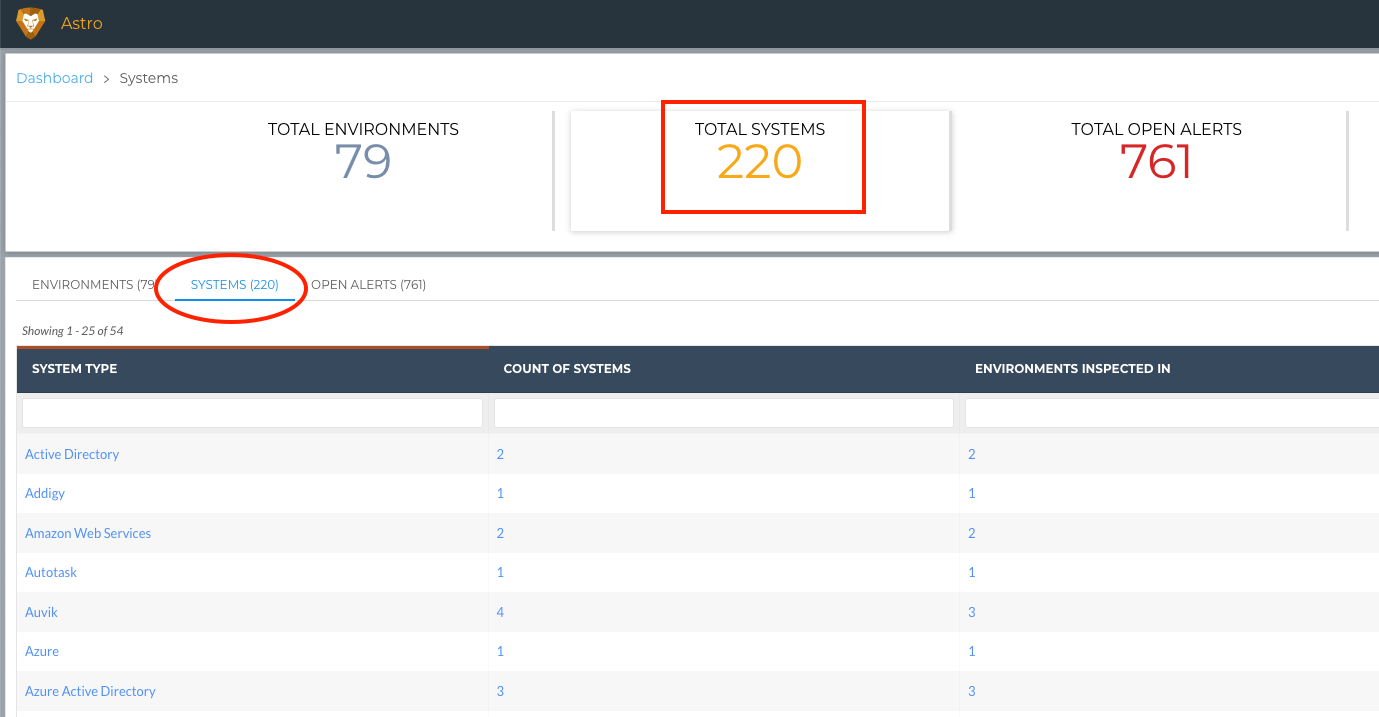
This tab will display a table with a list of all of the System Inspector Types that you've rolled out in Liongard. Here you'll find:
- System Type
- Count of Systems rolled out for the associated System Inspector Type
- Environments Inspected in the associated System Inspector Type
- The number of Open Alerts associated to the System Inspector Type
Single Environment Dashboard
When you click into an individual Environment, you will be directed to the Overview tab of the Single Environment Dashboard.
You will find two additional tabs in the left sidebar that will be helpful in accessing your client's data.
Overview Tab
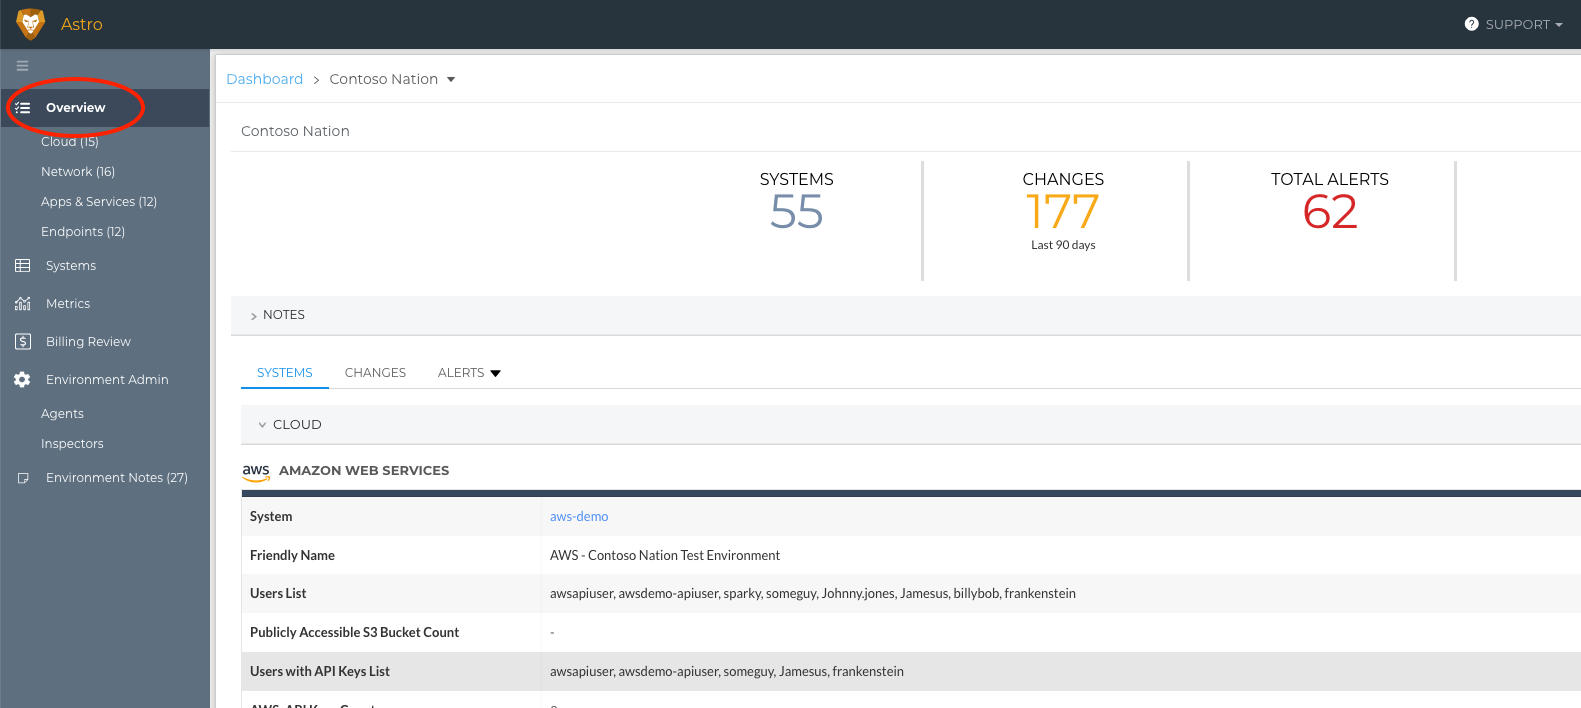
Here you will find an overview of the Environment. You'll find key stats about this Environment as well as a table for each Inspector that has been rolled out for this Environment. Each Inspector's table can be customized by selecting the Metrics you care about.
- Note: In each Inspector Type's table, you'll find a linked Inspector Friendly Name in the System Row/Column. Learn more about the Inspector's Inspection Screen here.
Why come to this screen? This screen is a great place to come to in order to get a quick overview of an Environment, the systems you are managing for that Environment, and some quick details about those Systems.
Systems Tab
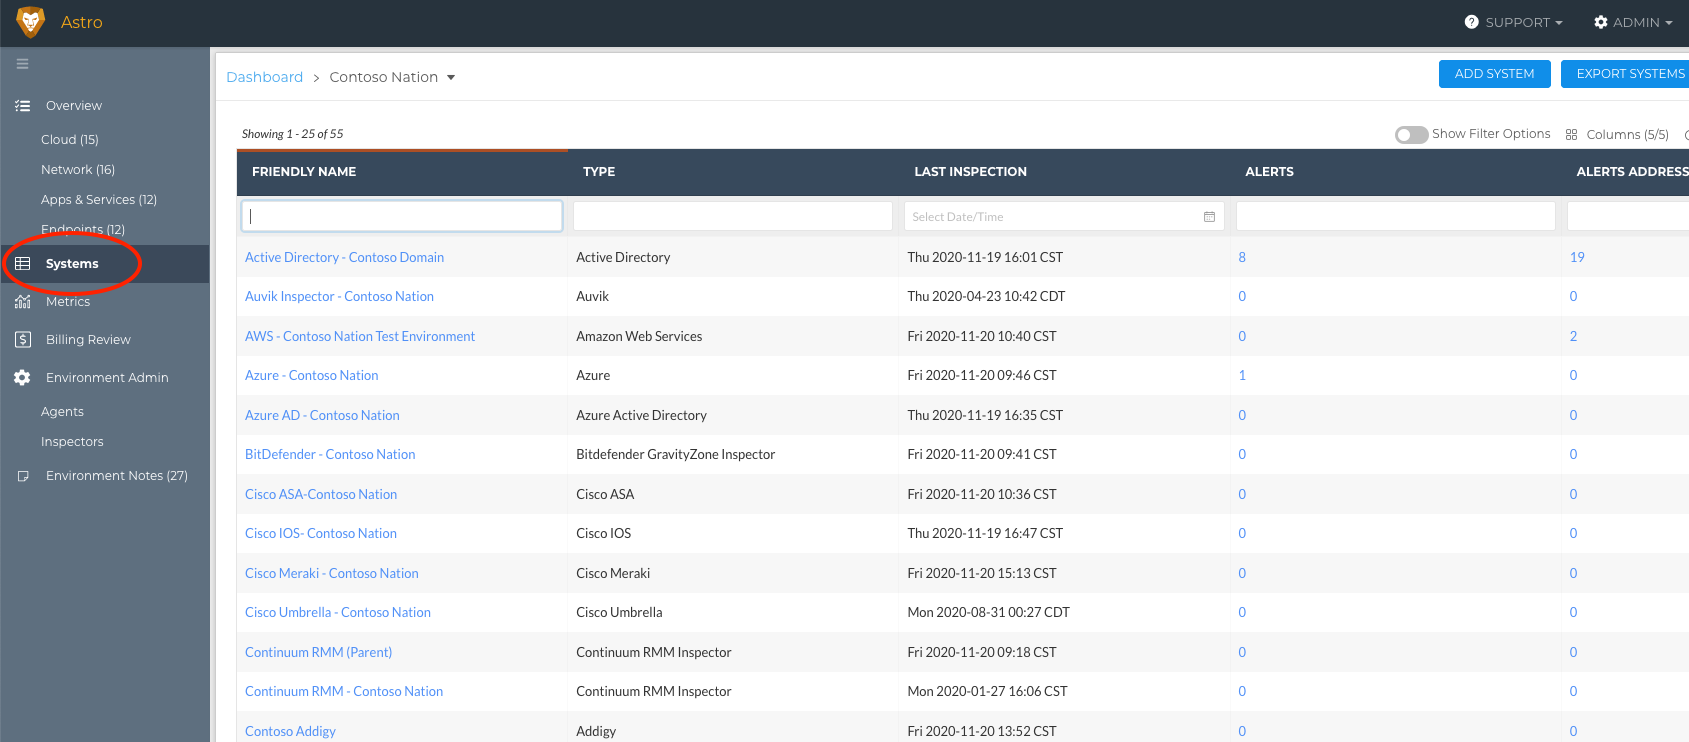
Here you'll find a list of all of the Inspectors that have been rolled out for the Environment.
- Note: You'll find a linked Inspector's Friendly Name in the Friendly Name Column for each Inspector listed. Learn more about the Inspector's Inspection Screen here.
Why come to this screen? This screen is a great place to get a quick overview of the Systems you are managing for an Environment.
Metrics Tab
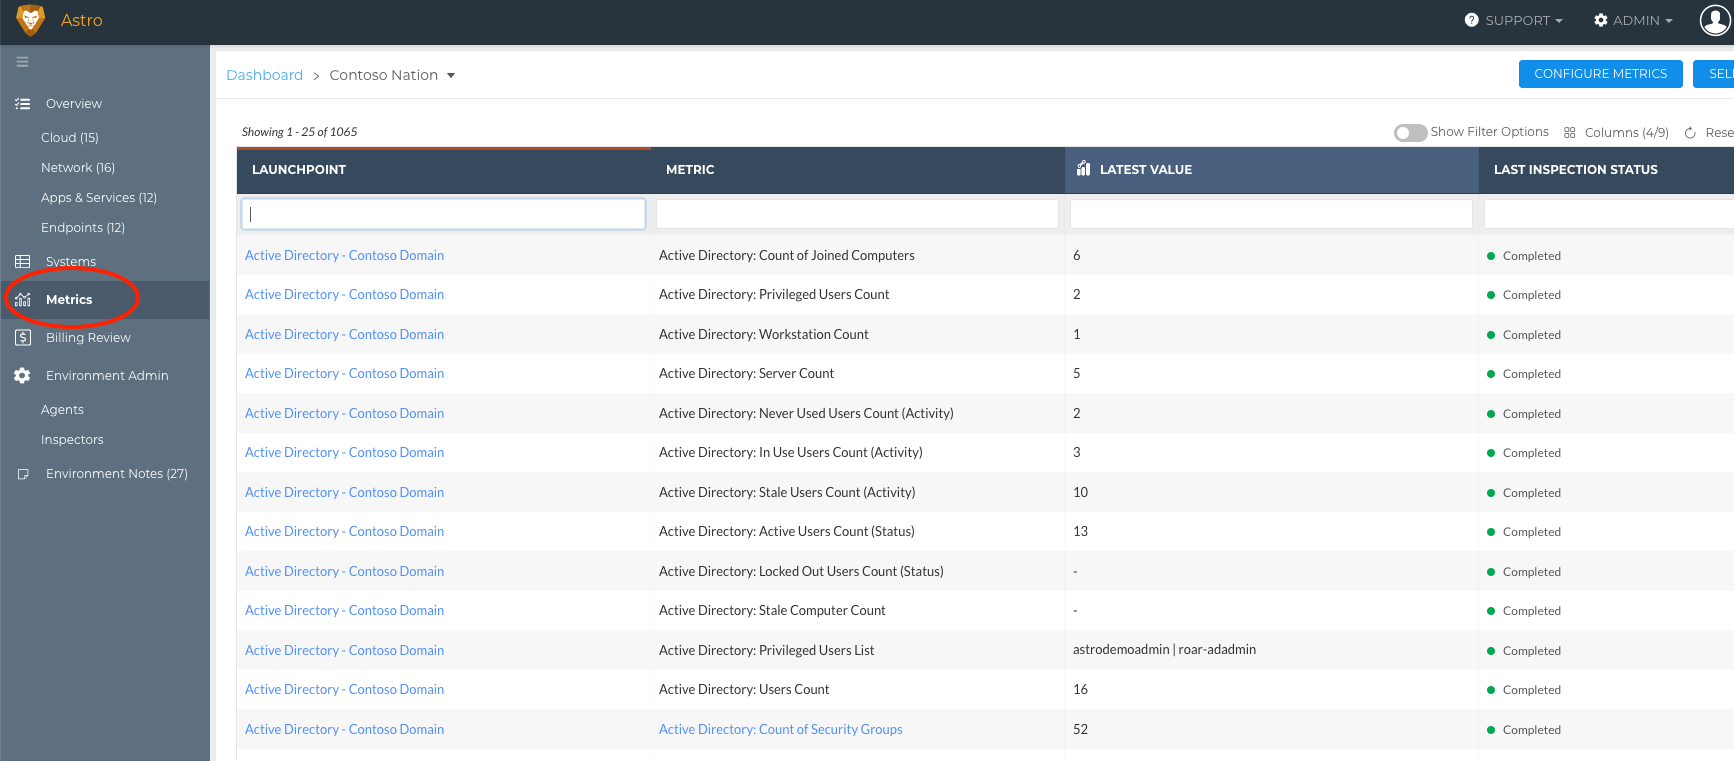
Here you'll find all of the Metrics that have been turned on across Inspectors. Metrics can be turned on in the Admin > Metrics screen.
- Note: You'll find a linked Inspector's Friendly Name in the Launchpoint Column for each Metric listed. Learn more about the Inspector's Inspection Screen, here.
Why come to this screen? This screen is a great place to come to in order to get a quick overview of an Environment through the Metrics that you care about, across the Systems that you're managing for that Environment.
For additional information see our Single Environment Dashboard documentation.
Individual System Inspector Type Screen
When you click into an individual Inspector Type Screen, you will be looking at the Systems Tab. This tab will be helpful in getting to your clients' data.
Systems Tab
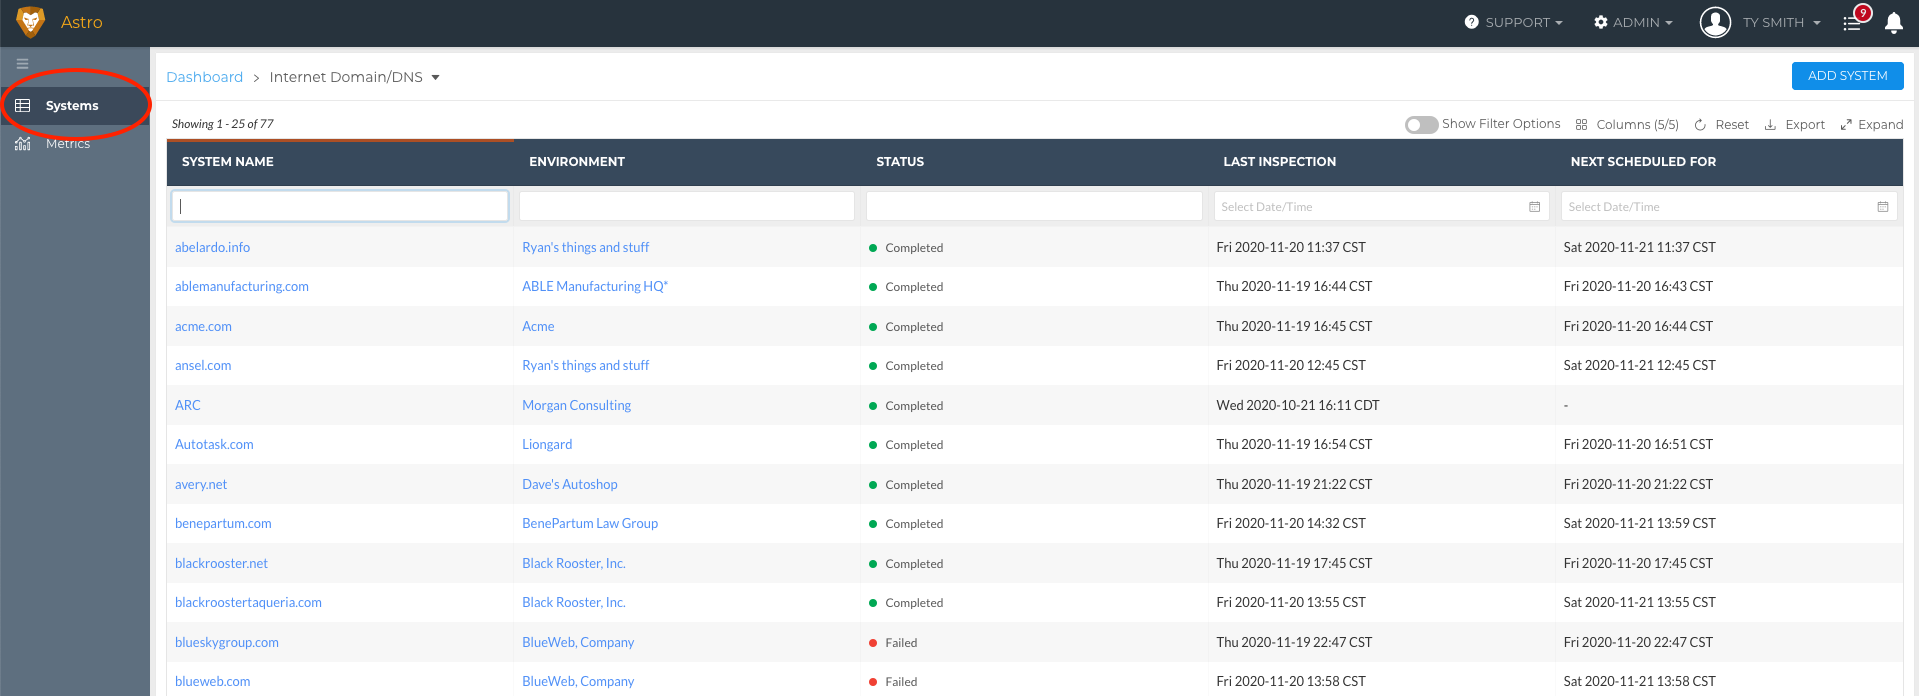
Here you'll find a list of all of the Inspectors that have been rolled out for the associated System Inspector Type.
- Note: You'll find a linked Inspector's Friendly Name in the Friendly Name Column for each Inspector listed. Learn more about the Inspector's Inspection Screen, here.
Why come to this screen? This screen is a great place to get a quick overview of the Environments in which you are managing this System Inspector Type.
Inspector's Inspection Screen
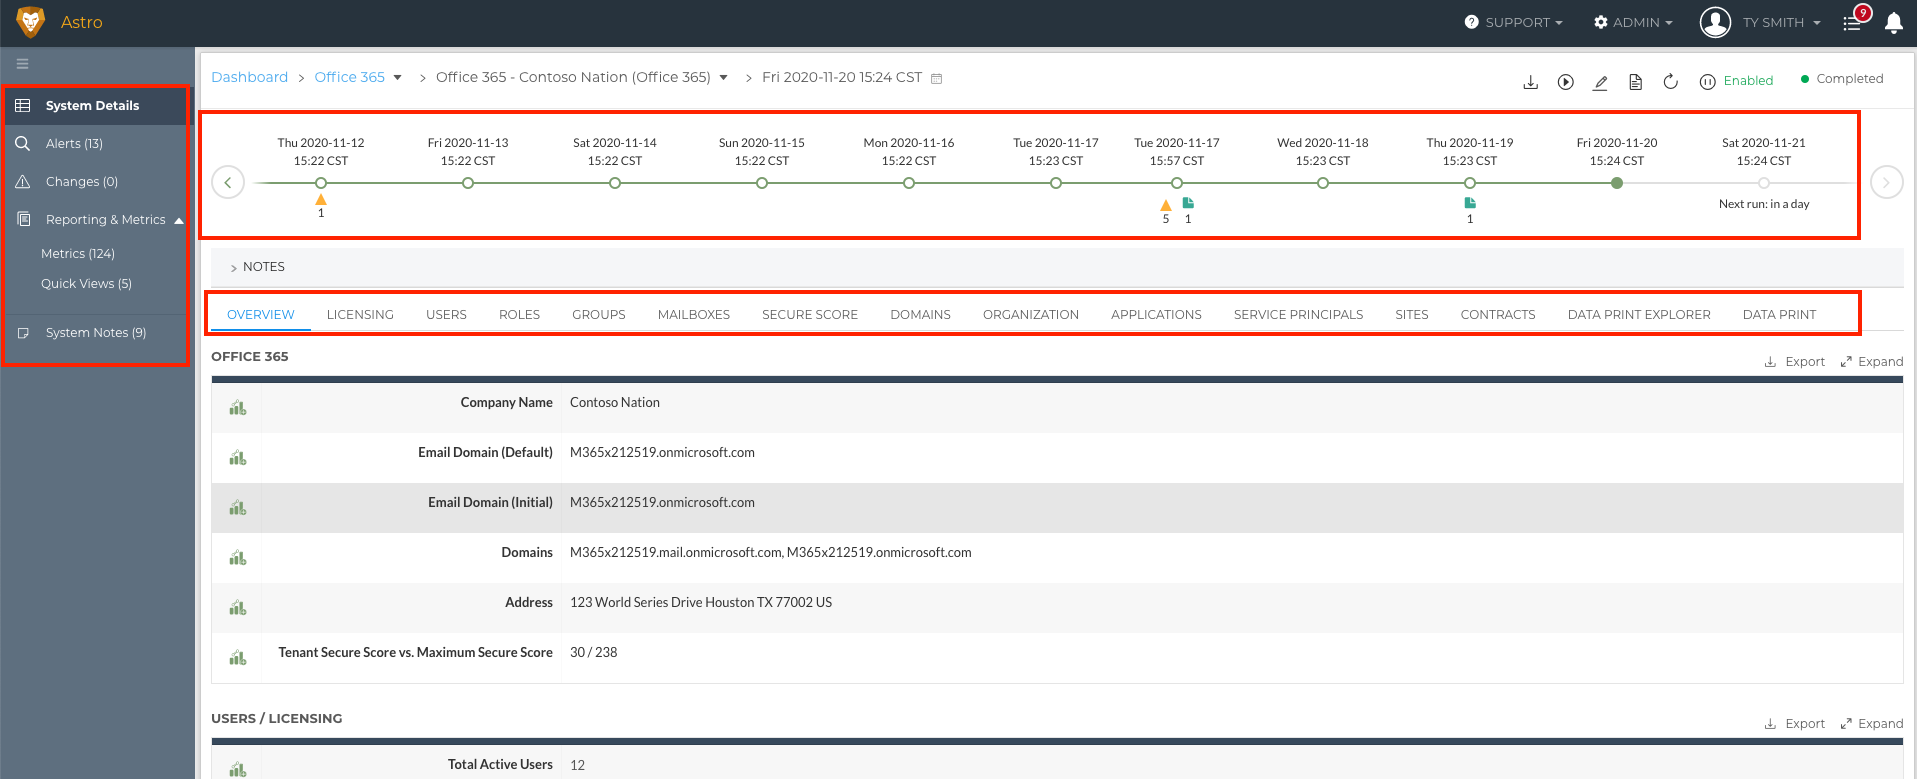
Here you'll find all of the data that Liongard can bring back on the associated system for the associated Environment, the Inspector's Timeline, as well as its associated Actionable Alerts, Change Detections, and Metrics.
Each Inspector's Inspection screen has Data Views. Data Views hold all of the data associated with the system being inspected.
Each Inspector's Inspection screen has a Timeline.
Timelines hold up to 18 months of documentation for their associated system. You can navigate backward and forward in Timelines by clicking on different dates or by selecting the calendar icon (above the Timeline next to the stated date and time of the Inspection you are currently looking at) and selecting a date on the calendar.
When you click on a date on the Timeline, all Data Views, as well as the Change Detections and Metrics tabs, will reflect the system's state on the date and time of the selected Timeline entry. Learn more about the Timeline and Change Detections here.
Lastly, each Inspector's Inspection screen has a left sidebar with System Details, Alerts, Changes, and Metrics tabs.
- System Details: Holds the Data Views
- Alerts: Lists open Alerts associated with this Inspector
- Changes: Lists the Timestamp, the Name, and details about the Change Detection for all Change Detections triggered on the selected Timeline entry
- Metrics: Lists Metrics that have been turned on in the Admin > Metrics tab associated with this system. The outputs of these Metrics reflect the system's state on the date and time of the selected Timeline entry
Why come to this screen? This screen is a great place to get insight through the data in Liongard's Data Views and to troubleshoot and change manage through the historical data found in Liongard's Timeline and Change Detections.
Using Liongard's Timeline and Change Detections
Timelines hold up to 18 months of documentation on their associated system. You can navigate backward and forward in Timelines by clicking on different dates or by selecting the calendar icon (above the Timeline next to the stated date and time of the Inspection you are currently looking at) and selecting a date on the calendar.
When you click on a date on the Timeline, all Data Views, as well as the Change Detections and Metrics tabs, will reflect the system's state on the date and time of the selected Timeline entry.
On Liongard's Timelines, you may see a little yellow delta icon under a Timeline entry. This is indicates a Change Detection has been triggered.
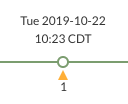
Change Detections note a change in the system. They indicate an addition to the system, a subtraction from the system, or the system's state before and after the change. For some Change Detections, the exact date and time that the change occurred
For details on a Change Detection, select a Timeline entry with a Change Detection present, and select the Changes tab in the left sidebar.
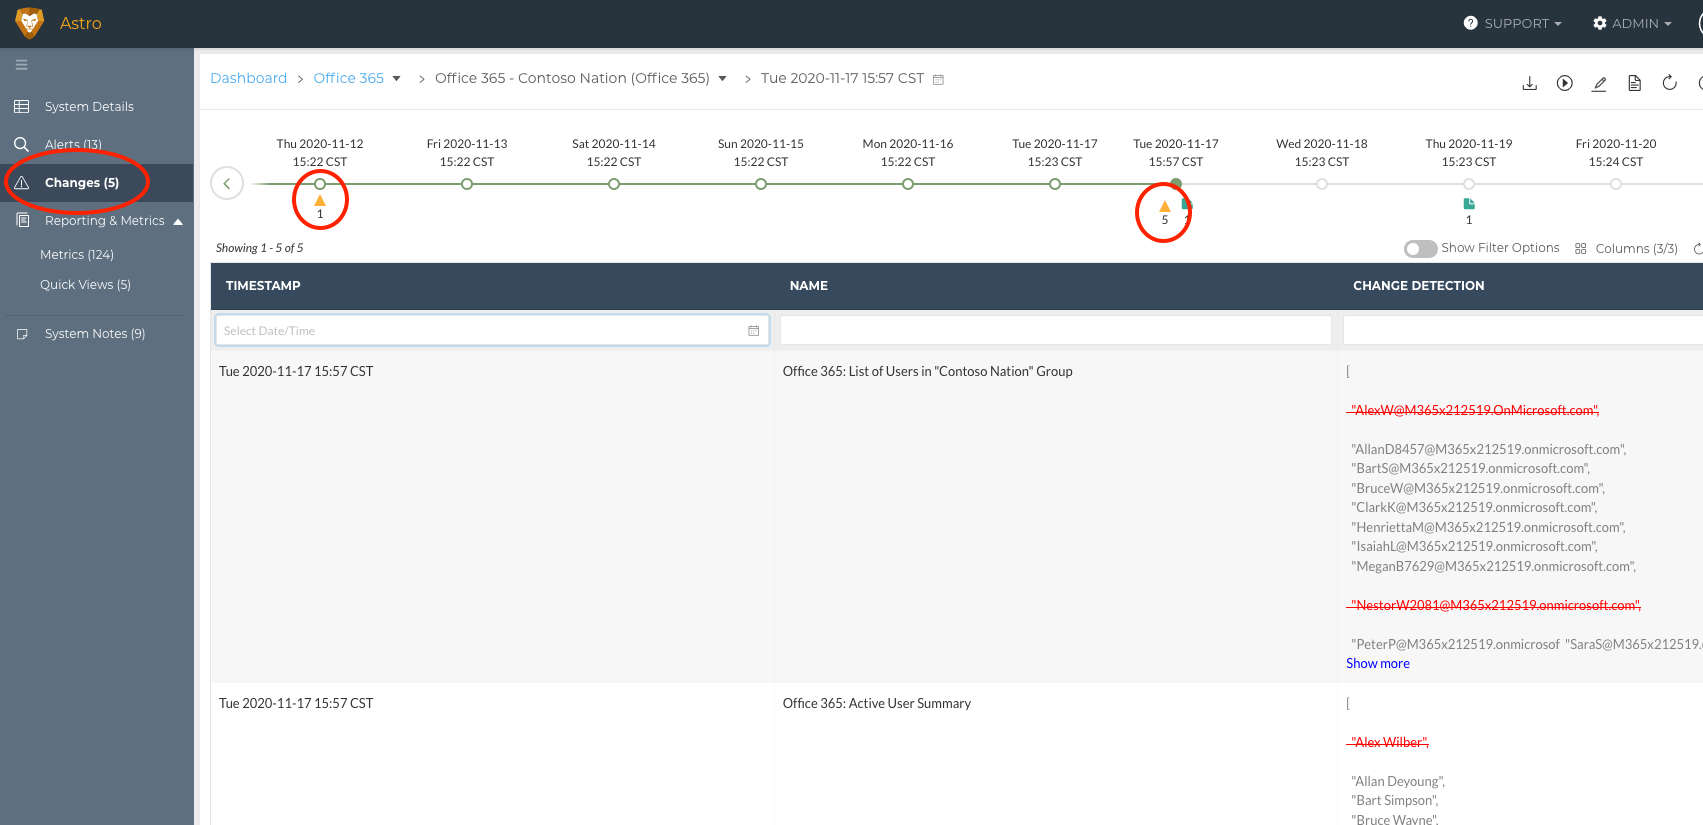
The Changes tab lists the Timestamp, the Name, and details about the Change Detection for all Change Detections triggered on the selected Timeline entry.
In the Change Detection column, you'll find in red and with a strikethrough a subtraction to the system or what the system looked like before the change. In green and underlined, you'll see an addition to the system or what the system looked like after the change.
NotesUsers have the ability to add human intelligence to Liongard's automation with our Notes feature. Notes are short text snippets that can be added to an Environment or a System in Liongard.
System-level notes can be tagged to a timeline entry to add more context to an inspection.
Interacting with Liongard's Data
You can customize all of Liongard's column oriented tables by:
You can better interact with all of Liongard's tables by:
All table customization in Liongard is scoped to the user account who made the changes and will be saved.
Selecting/Deselecting Columns
In the top right corner of Liongard's column-oriented tables, you can select/deselect columns.

Video isn't playing? Click here
Reordering Columns
You can reorder columns in Liongard by selecting one, dragging it over another, and dropping it. This will reorder the columns' positions.
Tip: Drop the arrow on the corner of the title of the column.

Video isn't playing? Click here
Resizing Columns
You can resize columns in Liongard by navigating to the right of the column you would like to resize. Then, select it when the mouse displays a resizing icon and drag and drop the column to a new width.

Video isn't playing? Click here
Filtering
All of Liongard's column-oriented tables can be filtered. You can take advantage of Liongard's basic filtering and/or advanced filtering options.
Basic Filtering
You can take advantage of Liongard's basic filtering in two ways:
- Selecting the header of a column in a table. This will filter the table alphabetically (A-Z or Z-A), in descending or ascending order, or chronologically
- Searching columns by entering characters contained in the results that you would like to see or by using the date and time picker in columns that include dates

Video isn't playing? Click here
You can remove filters by selecting the "x" to the right of a filter that you would like to remove, or by selecting "[x] Clear Filters" to remove all filters applied to a table, or by selecting the "(x)" to the right of a date and time filtered field.

Advanced Filtering Options
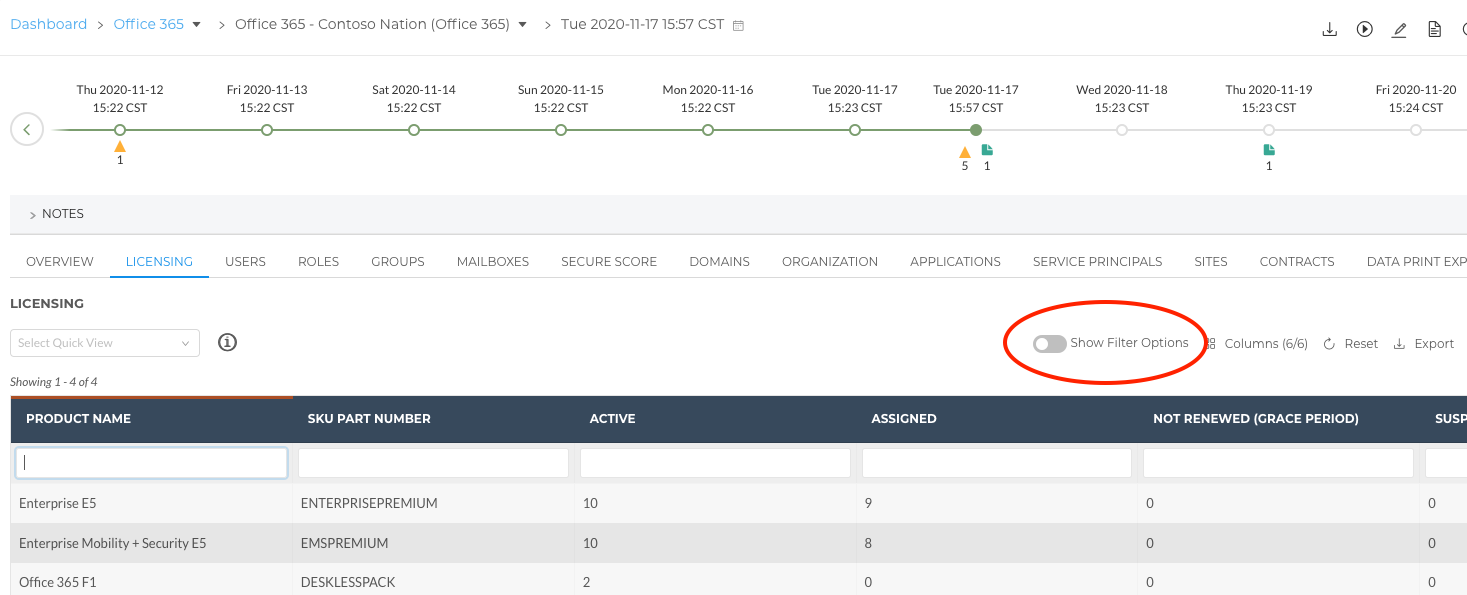
You can take advantage of Liongard's advanced filtering options by toggling on the Show Filter Options in the top right corner of every table in Liongard.
When toggled on, you will have additional options for filtering.
Text Fields
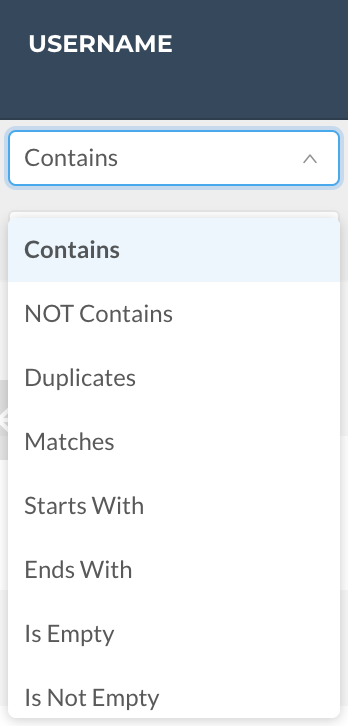
Filtering Options for text fields include:
- Contains (Default filtering option): Enter characters contained in the results that you would like to see
- NOT Contains: Enter characters that you would like to disclude from the returned results
- Duplicates: Filter for rows with the exact same results
- Matches: Enter the exact (case sensitive) characters contained in the results that you would like to see
- Starts With: Enter the first character(s) contained in the results that you would like to see
- Ends With: Enter the last character(s) contained in the results that you would like to see
- Is Empty: Filter for rows whose results are null/empty
- Is Not Empty: Filter out rows whose results are null/empty
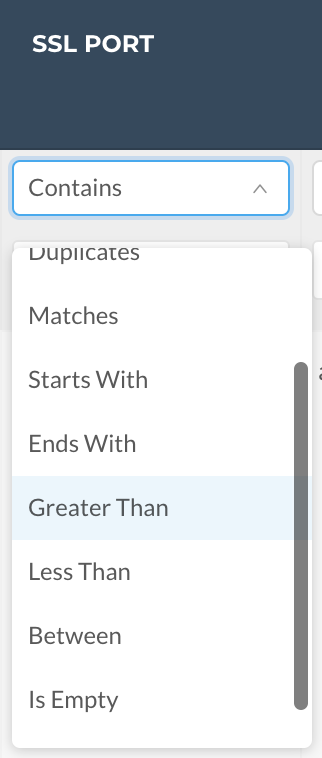
Number Fields
Filtering Options for text fields include all those you will find for text fields with a few additions:
- Contains (Default filtering option): Enter characters contained in the results that you would like to see
- NOT Contains: Enter characters that you would like to disclude from the returned results
- Duplicates: Filter for rows with the exact same results
- Matches: Enter the exact (case sensitive) characters contained in the results that you would like to see
- Starts With: Enter the first character(s) contained in the results that you would like to see
- Ends With: Enter the last character(s) contained in the results that you would like to see
- Greater Than: Enter a number in which you'd like to see results greater than
- Less Than: Enter a number in which you'd like to see results less than
- Between: Enter a number, dash ("-"), and another number. This creates a range in which you'd like to see the results returned
- Is Empty: Filter for rows whose results are null/empty
- Is Not Empty: Filter out rows whose results are null/empty
Date Fields
Date fields have a built in date picker function. To use this function, select anywhere in the text field below the desired date field and select a date. You can select a date by selecting the year, month, and day, and, optionally, select a time.
Also, you can select the single arrows to the left or the right to move a month at a time through the date picker or use the double arrows to the left or the right to move a year at a time through the date picker.
Lastly, you can select the Now option to select the date and time at that moment.

Video isn't playing? Click here
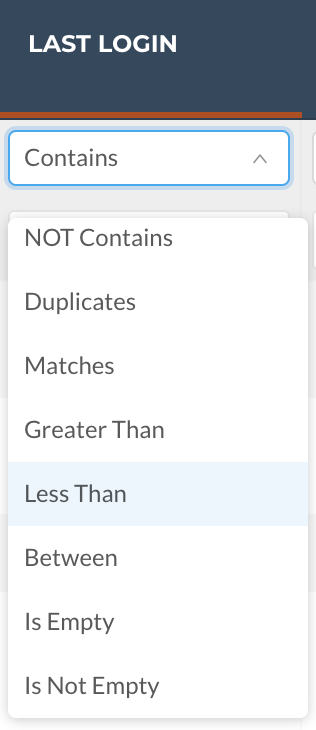
Filtering Options for date fields include:
- Contains (Default filtering option): Select a date contained in the results that you would like to see
- NOT Contains: Select a date that you would like to disclude from the returned results
- Duplicates: Filter for rows with the exact same results
- Matches: Select the exact (case sensitive) characters contained in the results that you would like to see
- Greater Than: Select a date in which you'd like to see results sooner than
- Less Than: Select a date in which you'd like to see results later than
- Between: Select a date, followed by a later date, creating a range in which you'd like to see the results returned
- Is Empty: Filter for rows whose results are null/empty
- Is Not Empty: Filter out rows whose results are null/empty
Exporting
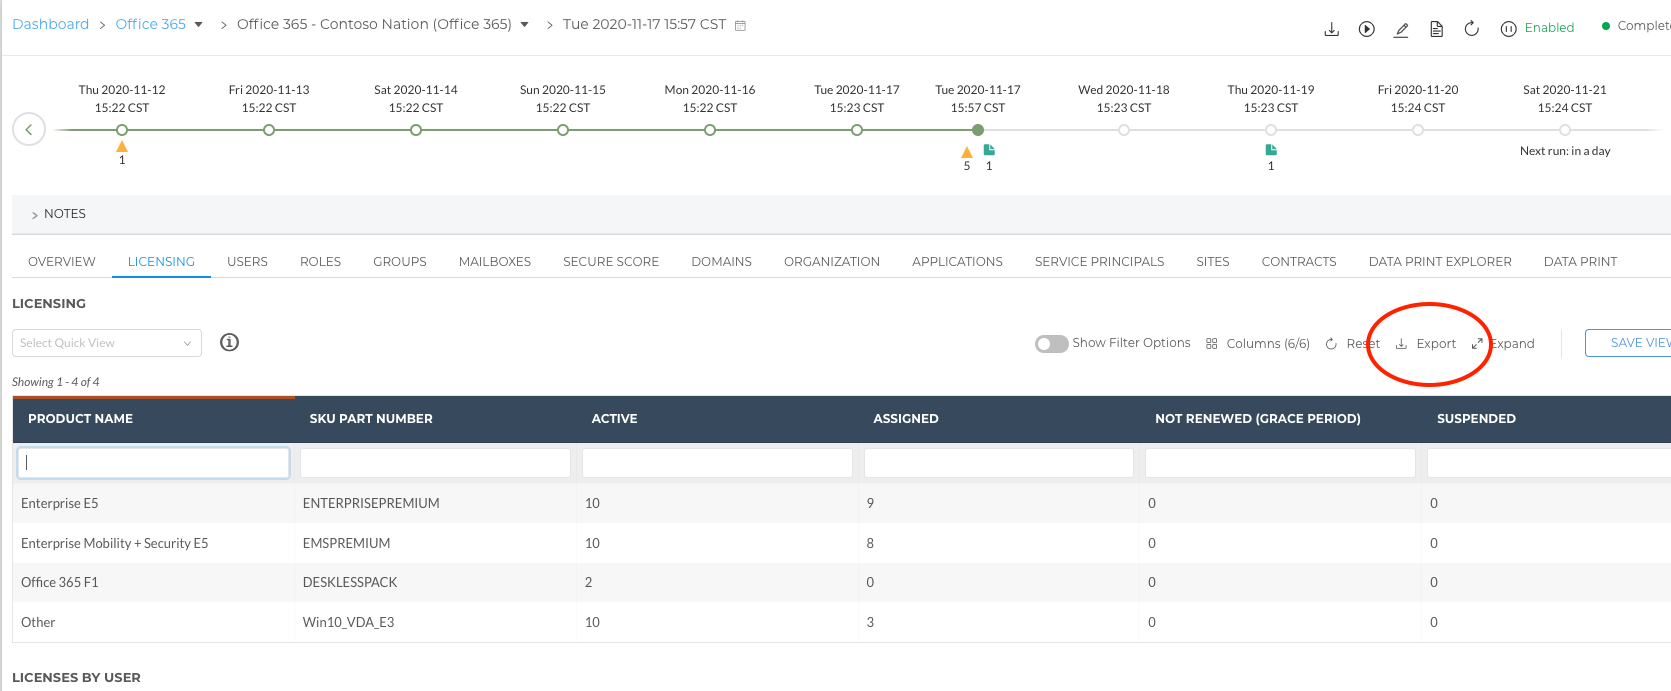
All of Liongard's tables can be exported to a CSV file. To export to a CSV, select the Export option in the top right corner of a table. When exporting in Liongard, the export will exactly reflect the table you see in Liongard. If you have filtered the table through basic filtering or advanced filtering options, then, the filtering will be reflected in the export.
Expanding
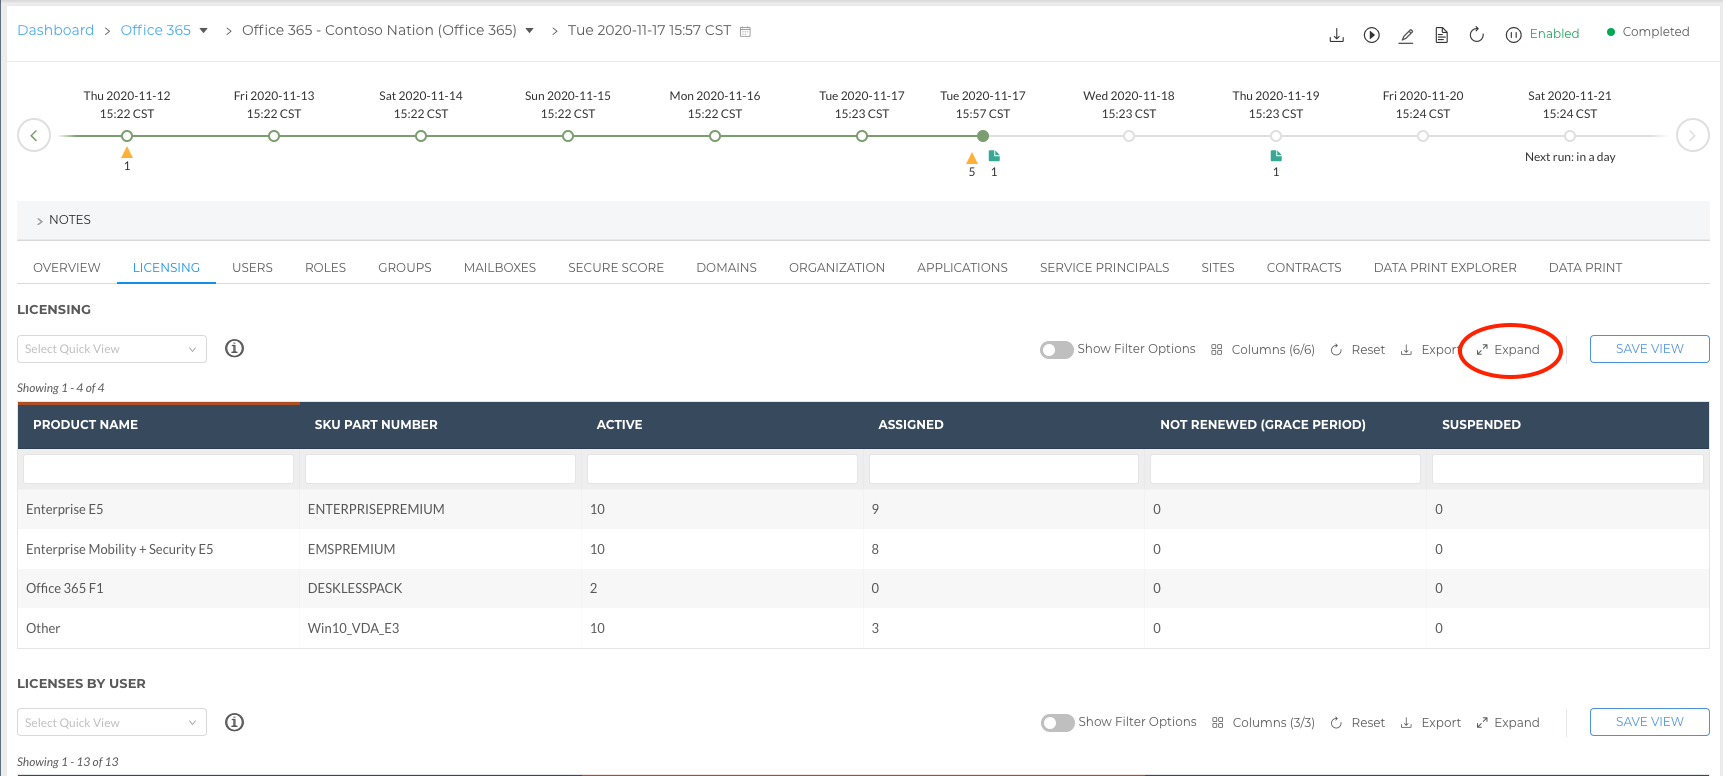
All of Liongard's tables can be expanded to allow for easier digestion and interaction. To expand or unexpand any table in Liongard, select the Expand or Unexpand option in the top right corner of a table.
Resetting Tables
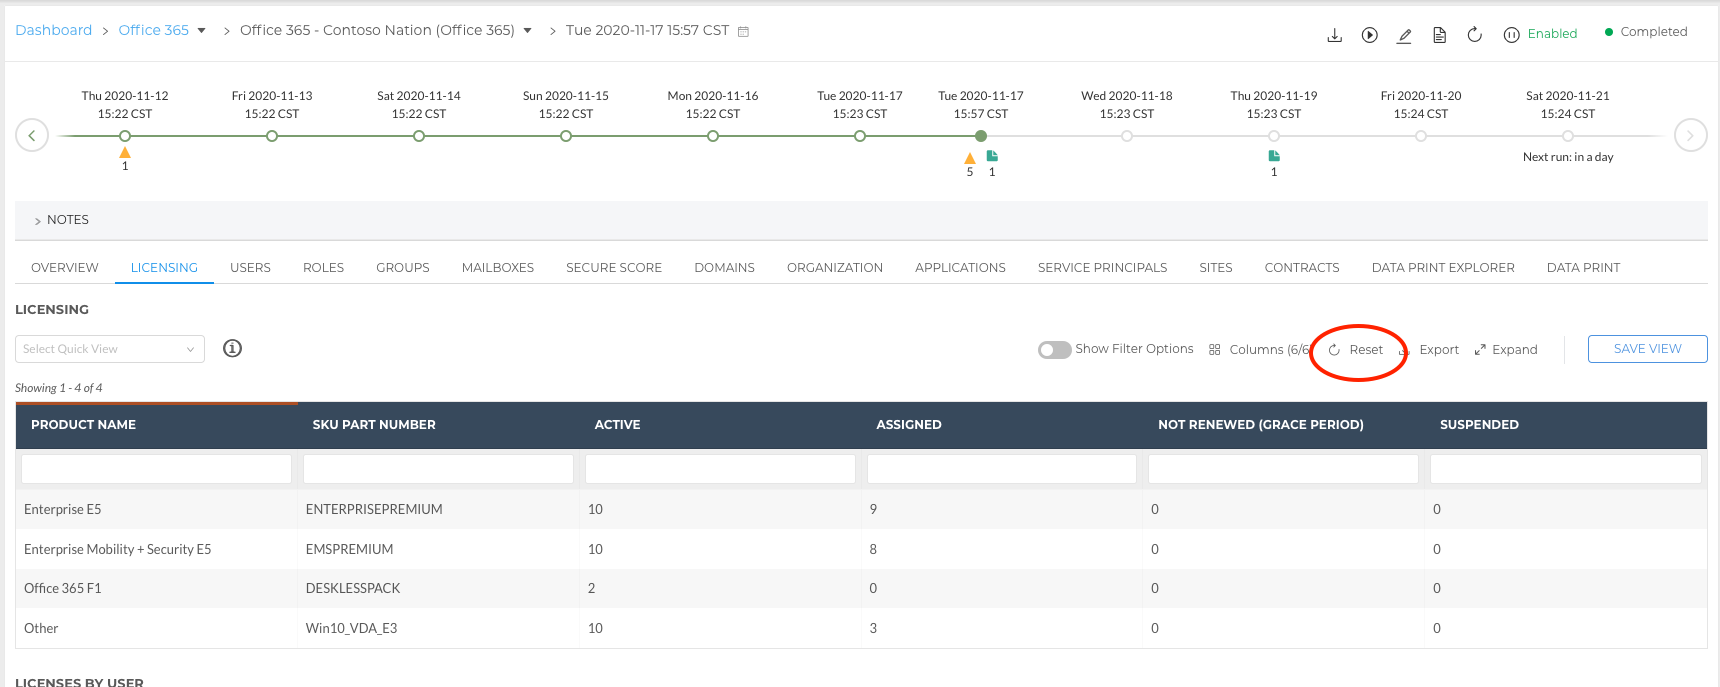
To revert the tables to their default state, including order of columns, columns selected in the column picker, and filtering, select the Reset option in the top right corner of a table.
Updated 7 months ago
