Data Print Explorer for Large Data Prints
Overview
The Data Print Explorer captures the raw data, or Data Print, Liongard's Inspectors return. The Data Print Explorer can be found by navigating to a System Inspector's System Details screen. The Data Print Explorer will be the last Data View tab.
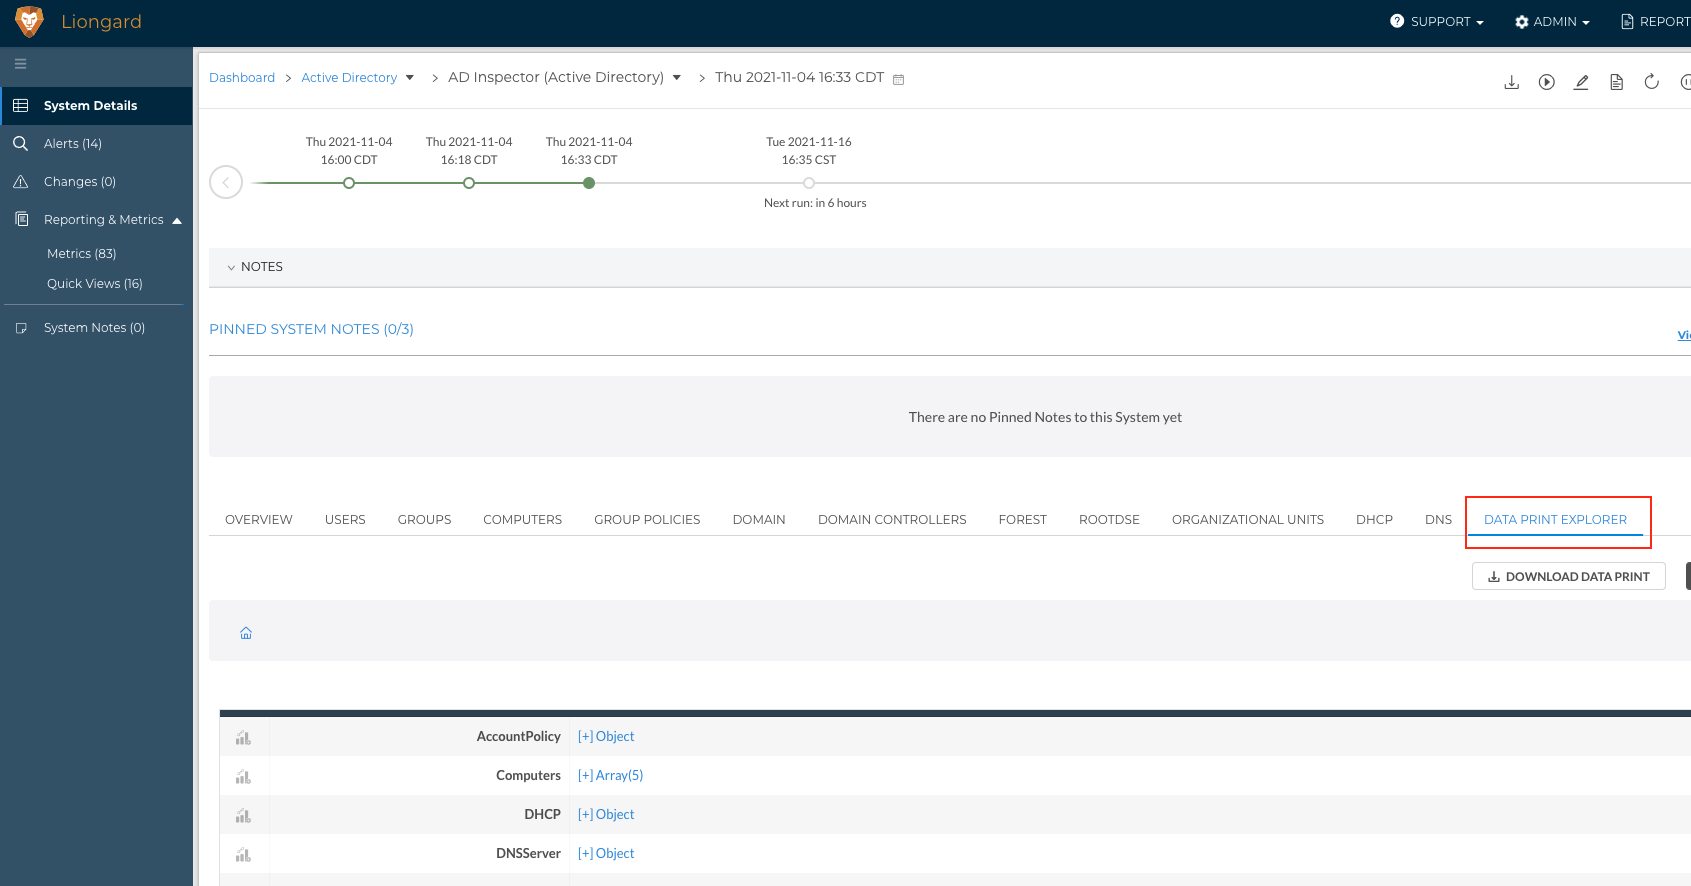
The Data Print can be explored using the "Tree" or "Table" view.
Tree View Example

Table View Example
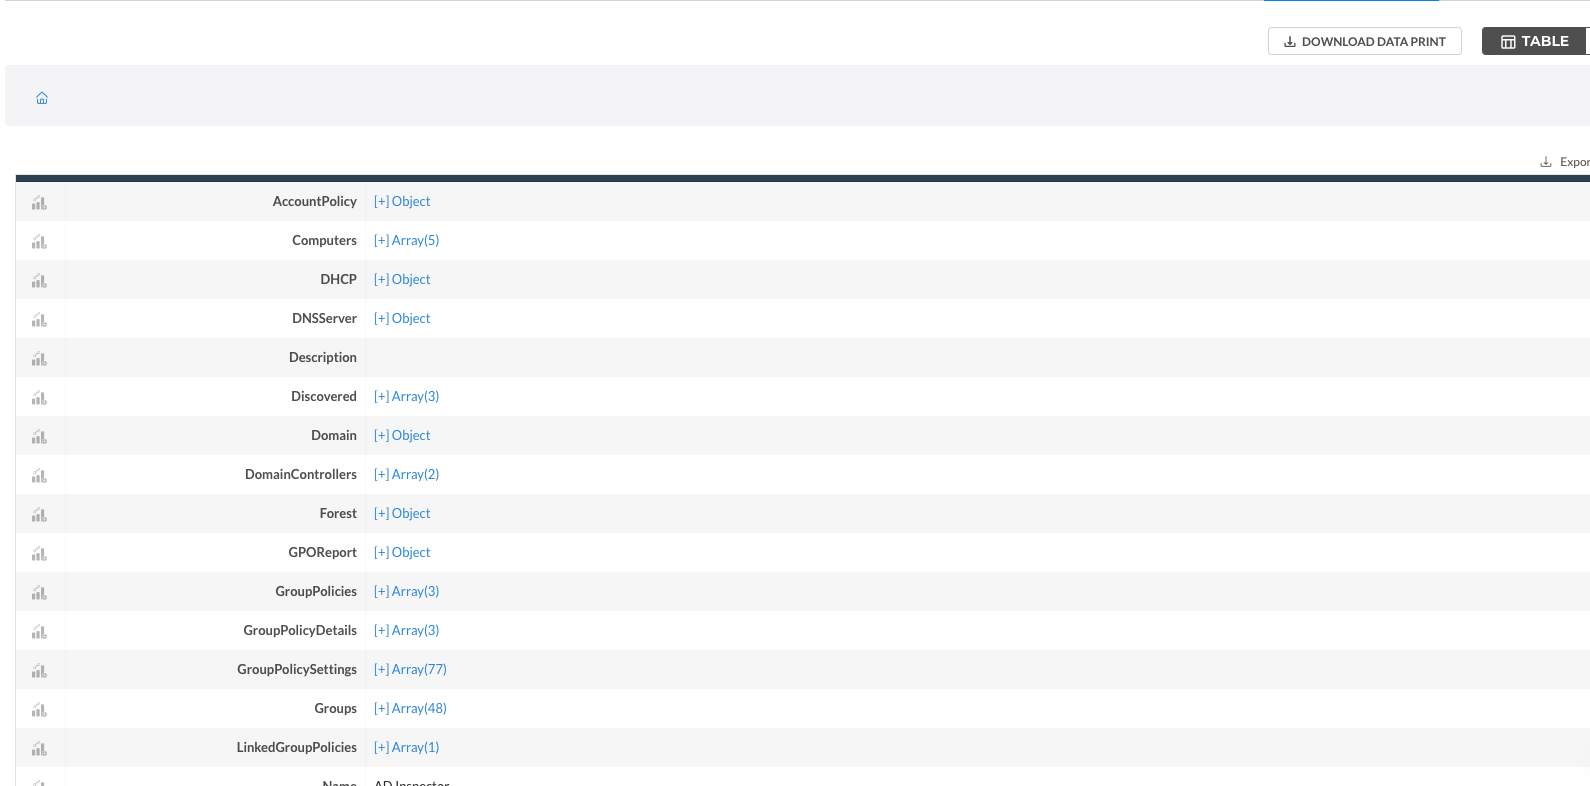
The "Table" view must be used when an Inspector's Data Print exceeds 25 MB. This document outlines how to explore the Data Print and build a Metric using the "Table" view of the Data Print Explorer.
Key Differences with the Table View vs. Tree View of the Data Print Explorer
The Table View of the Data Print Explorer contains the same data found in the traditional Tree view; however, there are a few important things to keep in mind when using the Table view to create a Metric.
The top of the table will update with your navigational path as you click into Objects and/or Arrays. In the example shown below, we are viewing the Objects from the Members Array, which is found in the Groups Array.

Arrays are numerically ordered, starting with 0. The number within the array indicator (brackets) will reflect the array you are viewing.
Below you can see we are viewing the Objects from the Members Array, which is contained within the Groups Array. This is shown in our navigational path as Groups[1].

Clicking the Groups[1] hyperlink will step our navigation back one level to the Groups Array. The top of the table will reflect that change.
Clicking the Home icon will take you back to the top-level of the Data Print.
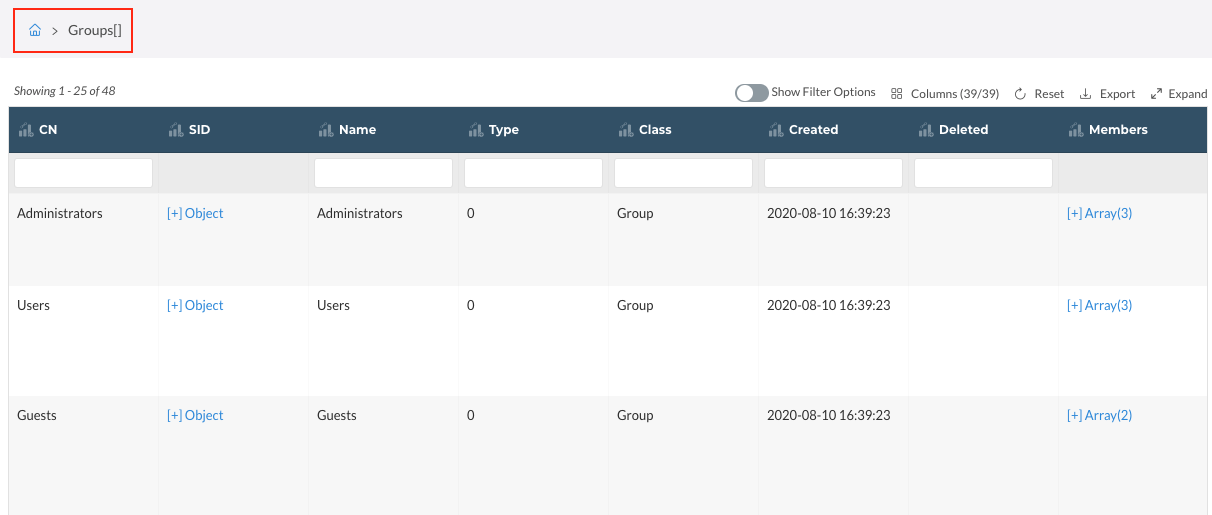
Keeping an eye on this navigational path will ensure that you always know what level of the Data Print you are currently exploring.
To copy the first-level path, you can use the Copy icon shown below.
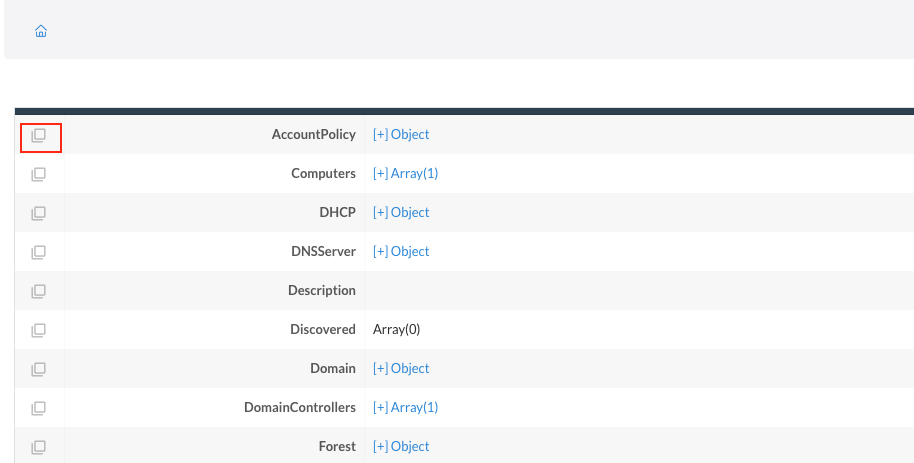
To copy the entire path for a single key-value, you can use the Copy icon shown below.

Using the Table View of the Data Print Explorer
Navigating the Table View
The Table View outlines the Data Print and its key-values. For any Array or Object, more data may be available. If there is more data available, a hyperlink will be present.

Within an Array, each Object will be presented as a different row in the table.
Data Print Explorer Example
Let's practice exploring the "Table" view of the Data Print Explorer with an example.
Let's say we want to find all of the users in the Administrators Users Group of an Active Directory Inspector.
Navigate to Dashboard > Systems > Active Directory > Click a System Name > Navigate to the Data Print Explorer tab > Select Table.

Now, we need to identify the particular data point we want to isolate.
For this example, we are looking for all of the users in the Administrators Users Group. We expect this data to be found in the Groups Array, so we will click the hyperlinked array.
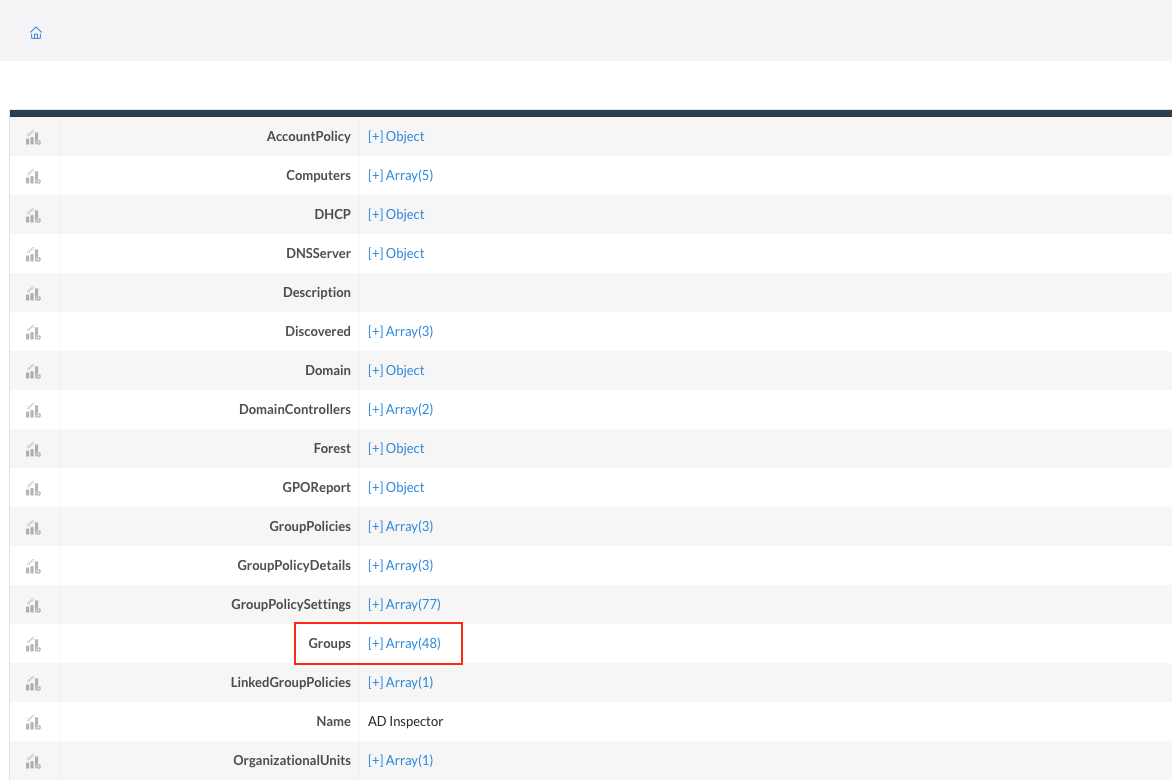
As you navigate in the table, your path will update at the top of the table.
As you can see, the Groups Array contains 48 Objects. Each Object is a different Group, and the data for each is captured in a separate row.
Looking at the Name object, let's find the Administrators User Group, so we can hone in on data for that particular group.
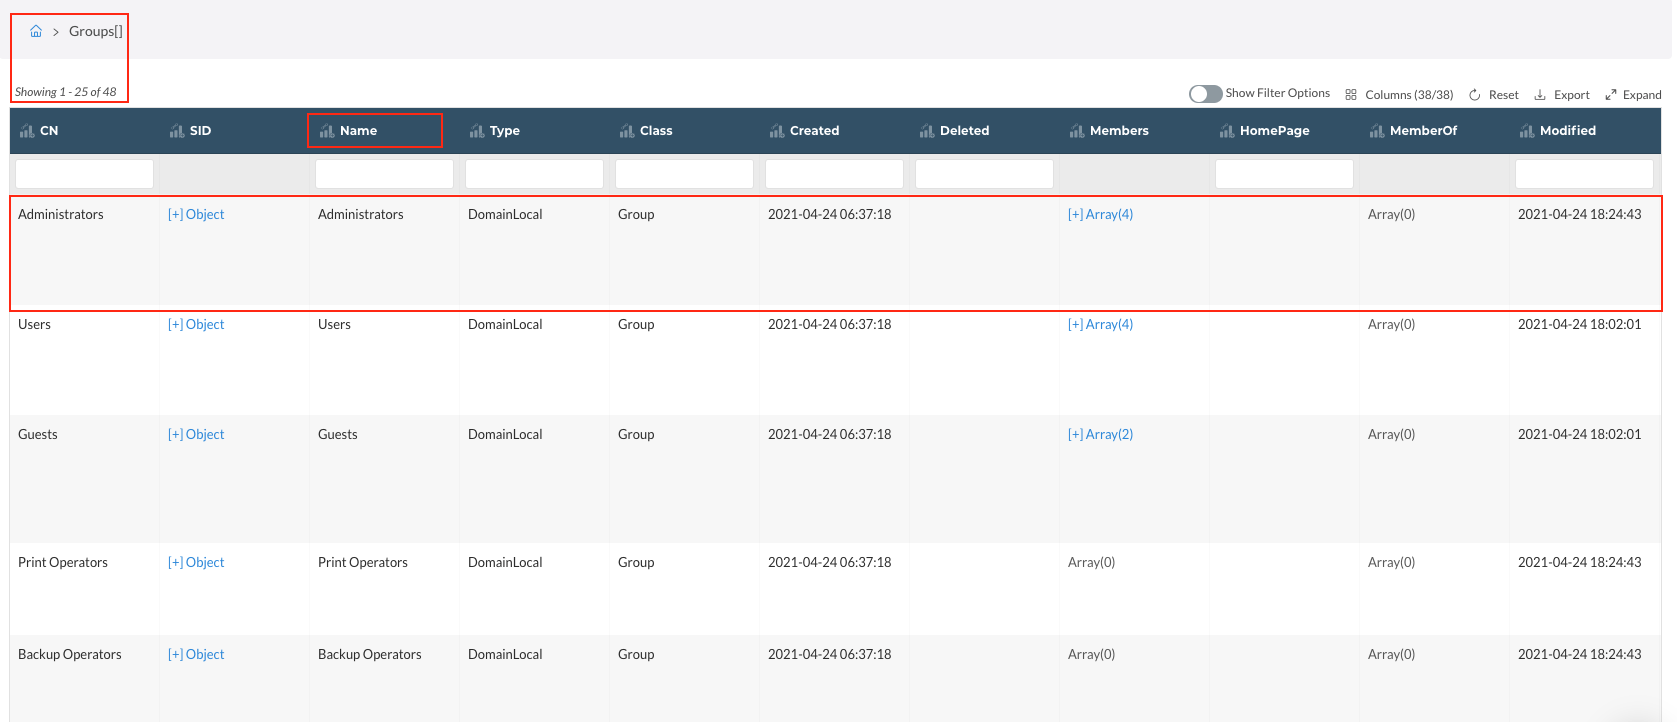
In this Array, there are 38 columns of Key-values, or data, for each Object.
Exploring these columns, we find a Key-value titled "MembersStr" which returns a list of users for each Group. For this example, this is the data we were hoping to isolate.
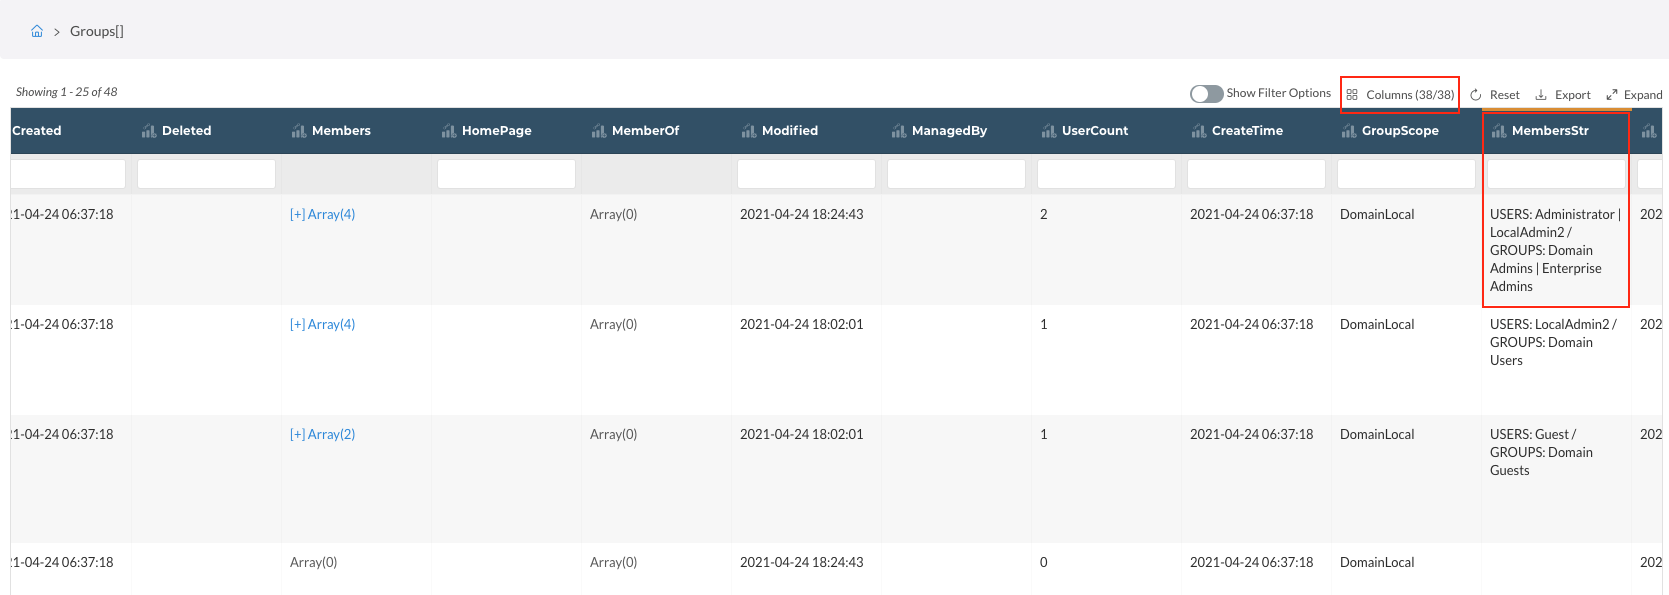
Create a Metric from the Data Print Explorer
Now that we've identified the data we would like to isolate we can create a Metric using the Create Metric button next to the MembersStrng Key-value.
Clicking the icon will present us with the Metric Builder pop-out. Here we can choose to either edit the Metric query further by selecting Edit in Builder or we can Save the Metric, as is.
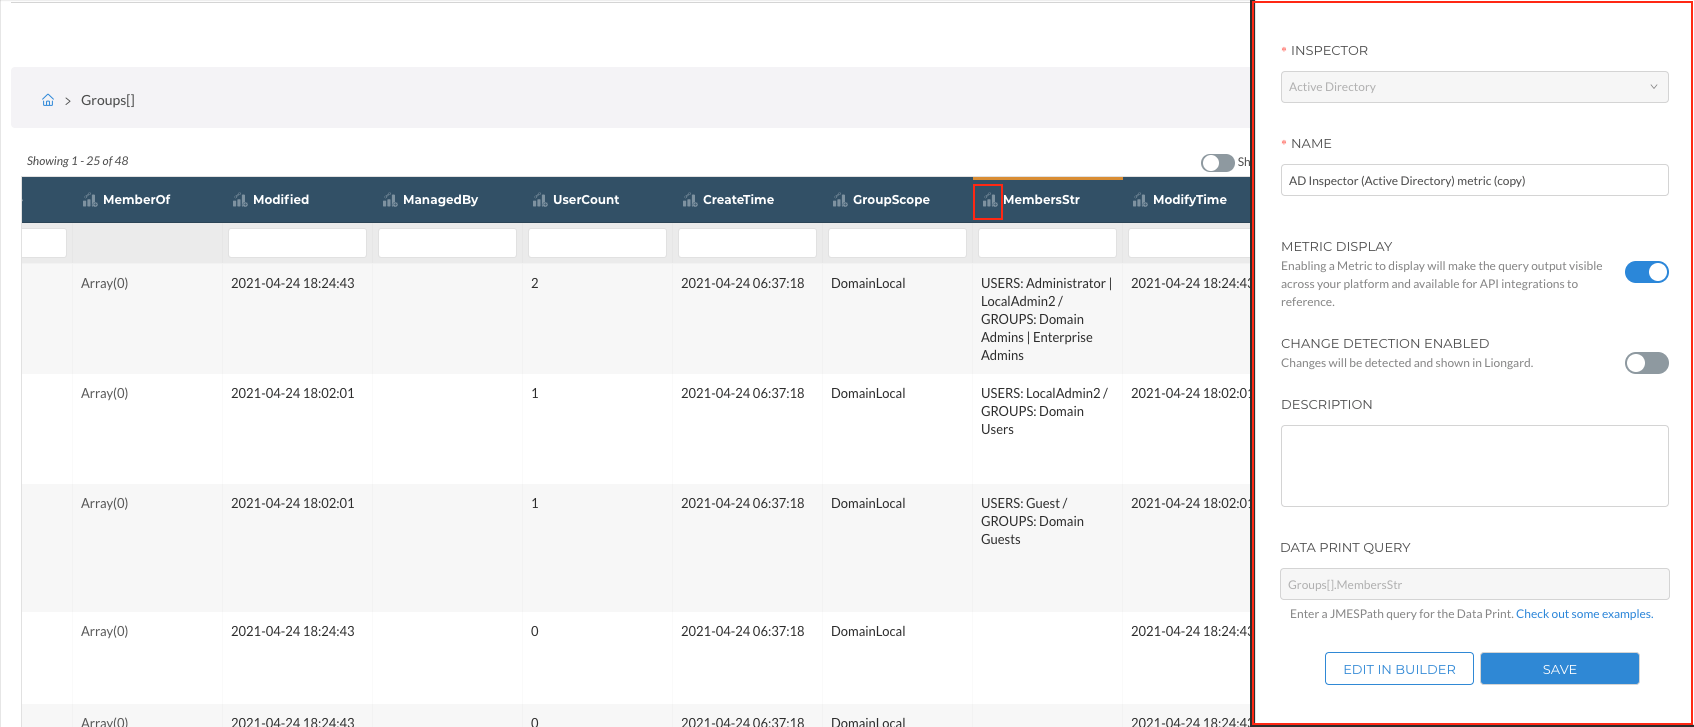
Create a Metric in the Metric Builder
If you are trying to write a Metric for a Data Print larger than 25 MB, you will need to use the Table view in the Metric Builder.
To access the Metric Builder, navigate to Admin > Metrics > Add Metric. When you select the System with a large Data Print, you will be prompted to select the Table view.
To learn more about writing a Metric, review our documentation.
Example of Writing a Metric using the Table View
Navigate to Admin > Metric > Add Metric
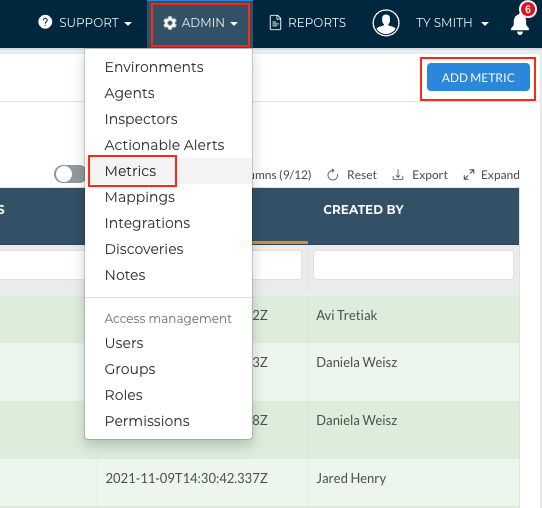
Complete the following fields:
- Inspector: Select the Inspector for the Metric you are creating. For this example, we will select Active Directory.
- Name: Name the new Metric
- Metric Display: Enabling the toggle will display the Metric in Liongard and will make the Metric available to third-party integrations
- Change Detection Enabled: Enabling the toggle will turn on a Change Detection for the Metric
- Description (Optional): Description of the Metric
After selecting a System and a recent timeline entry, you can now select the Table view to build your Metric.

Using the same example as above, we are looking for all of the users in the Administrators Users Group. We expect this data to be found in the Groups Array, so we will click the hyperlinked Array.
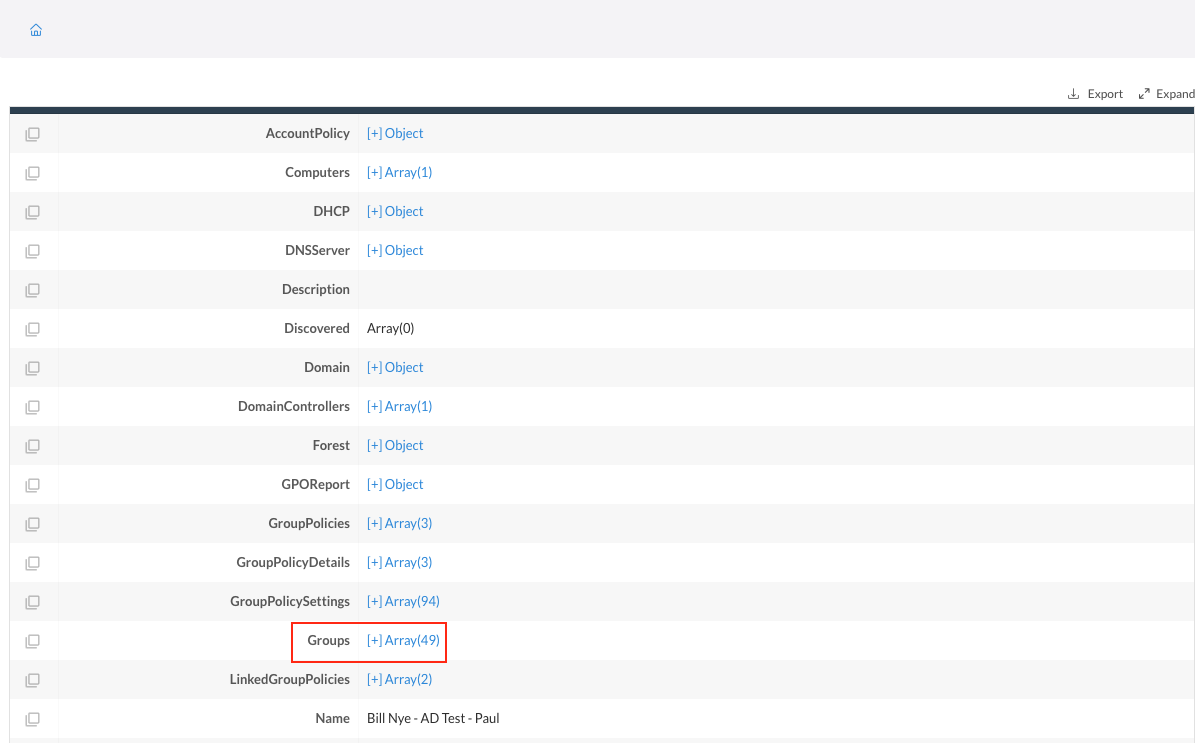
As you navigate in the table, your path will update at the top of the table.
Looking at the Name object, let's find the Administrators User Group, so we can hone in on data for that particular group.
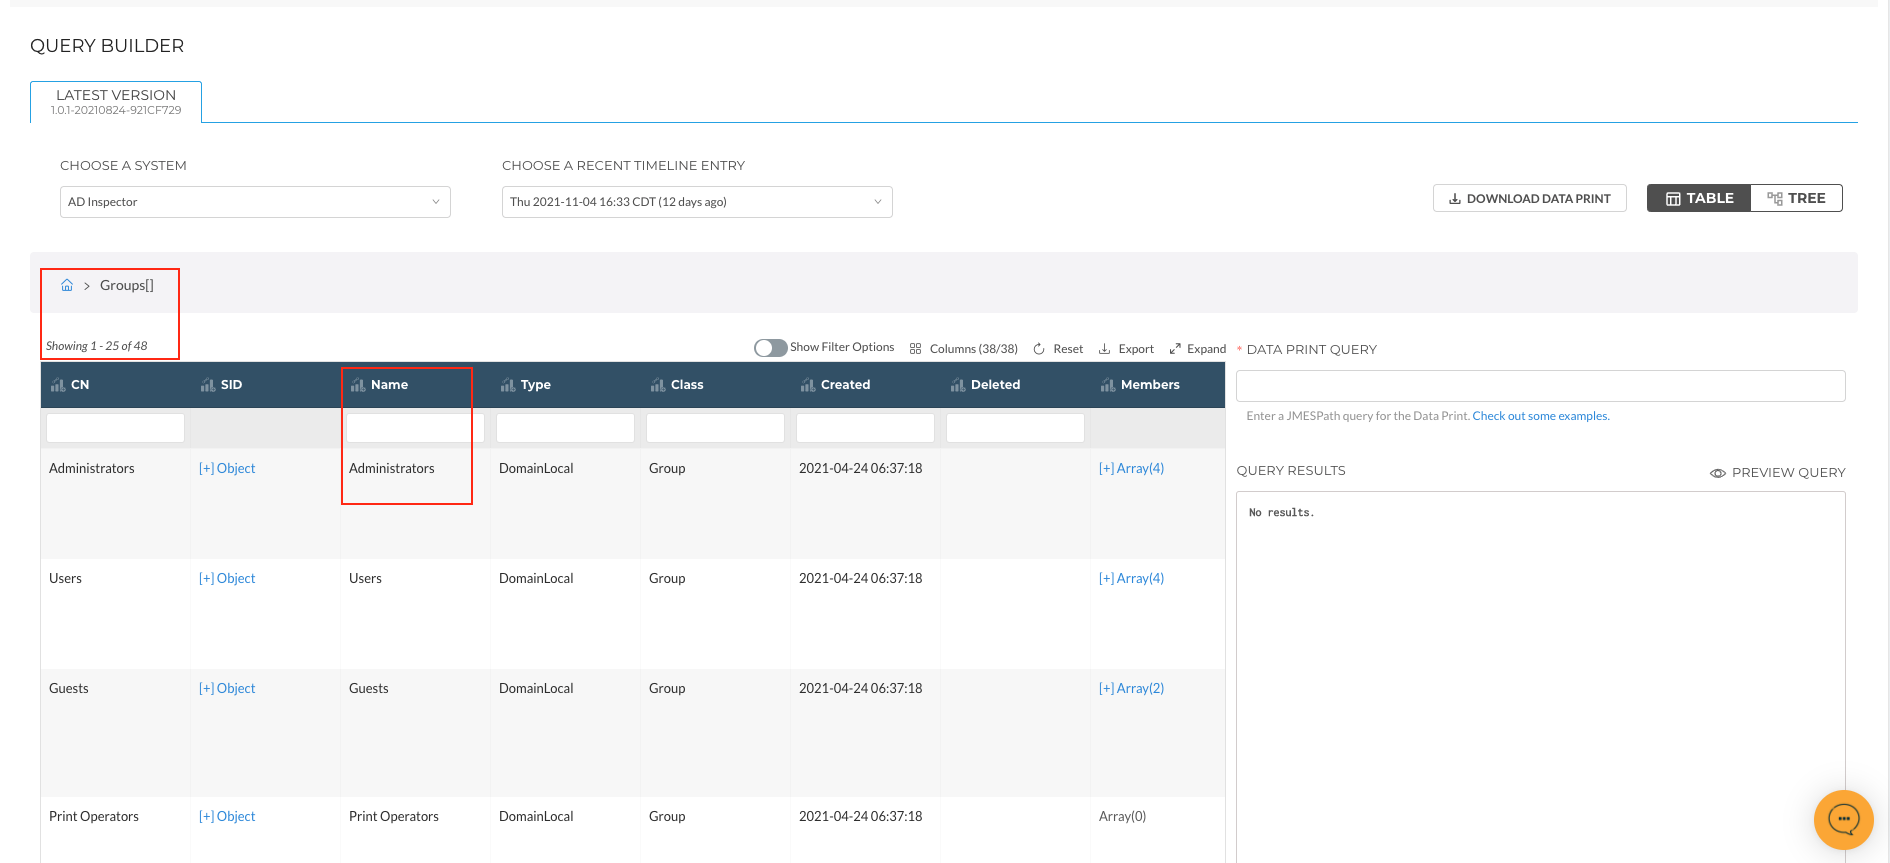
Exploring the Key-values columns, we find a Key-value titled "MembersStr" which returns a list of users for each Group.
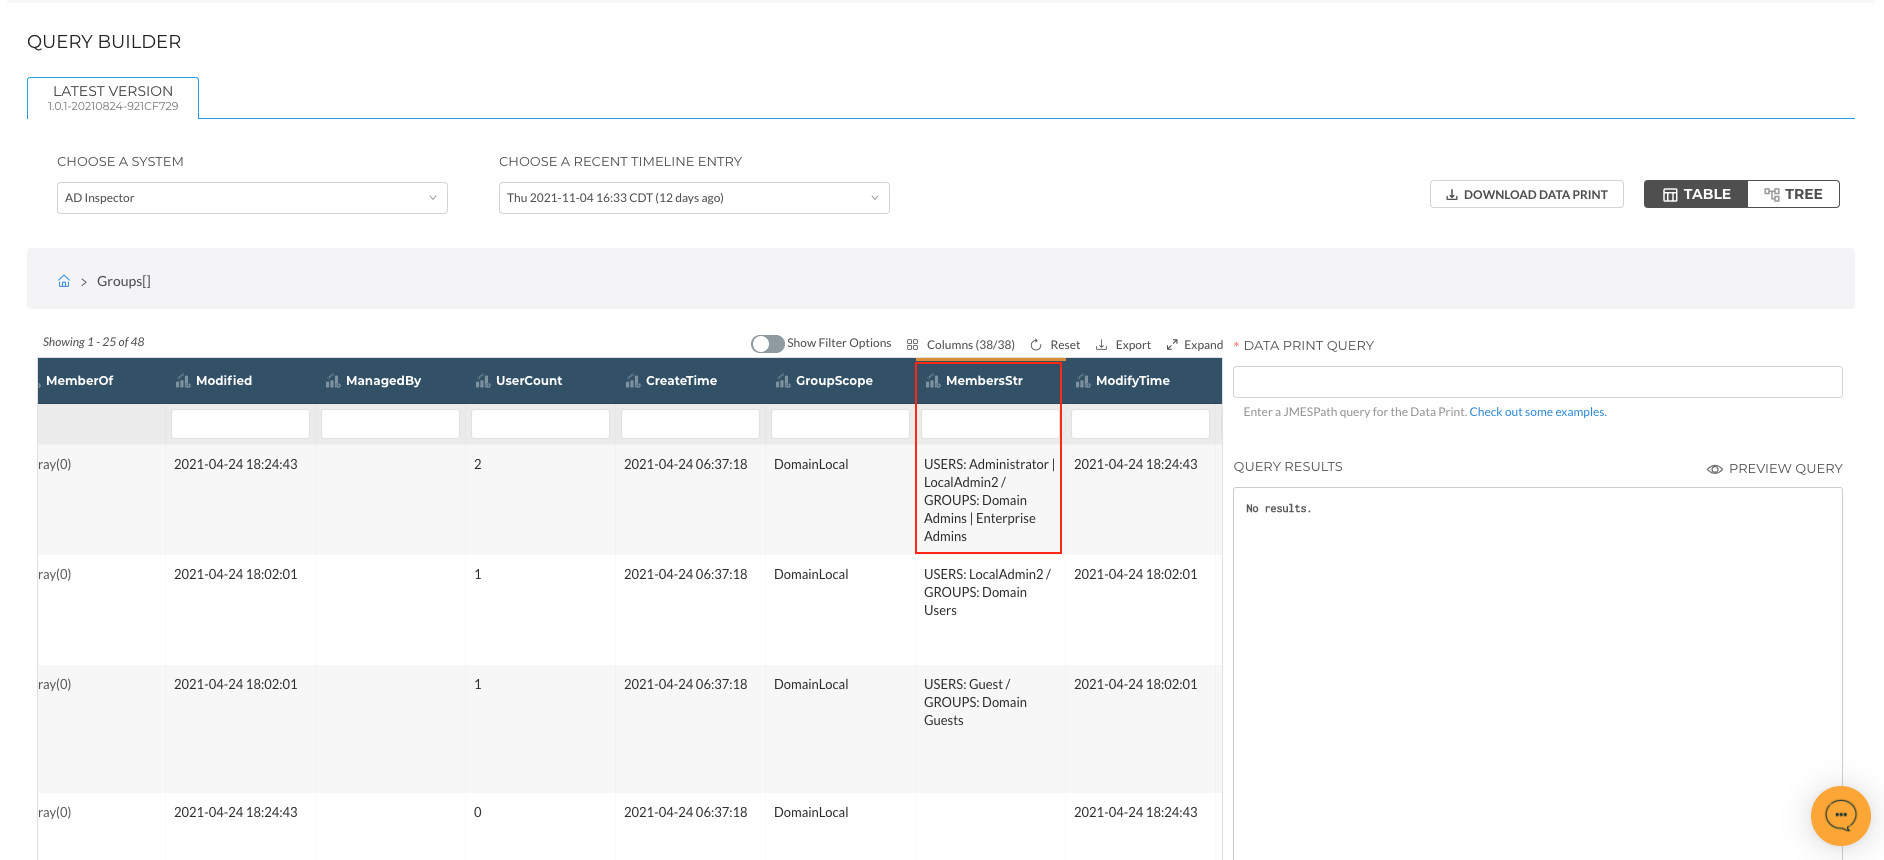
For this example, this is the data point we want to isolate.
We can easily create a Metric by clicking the Metric icon next to the name of the Key-value column.
This will copy the Metric path which we can then paste into the Data Print Query field.
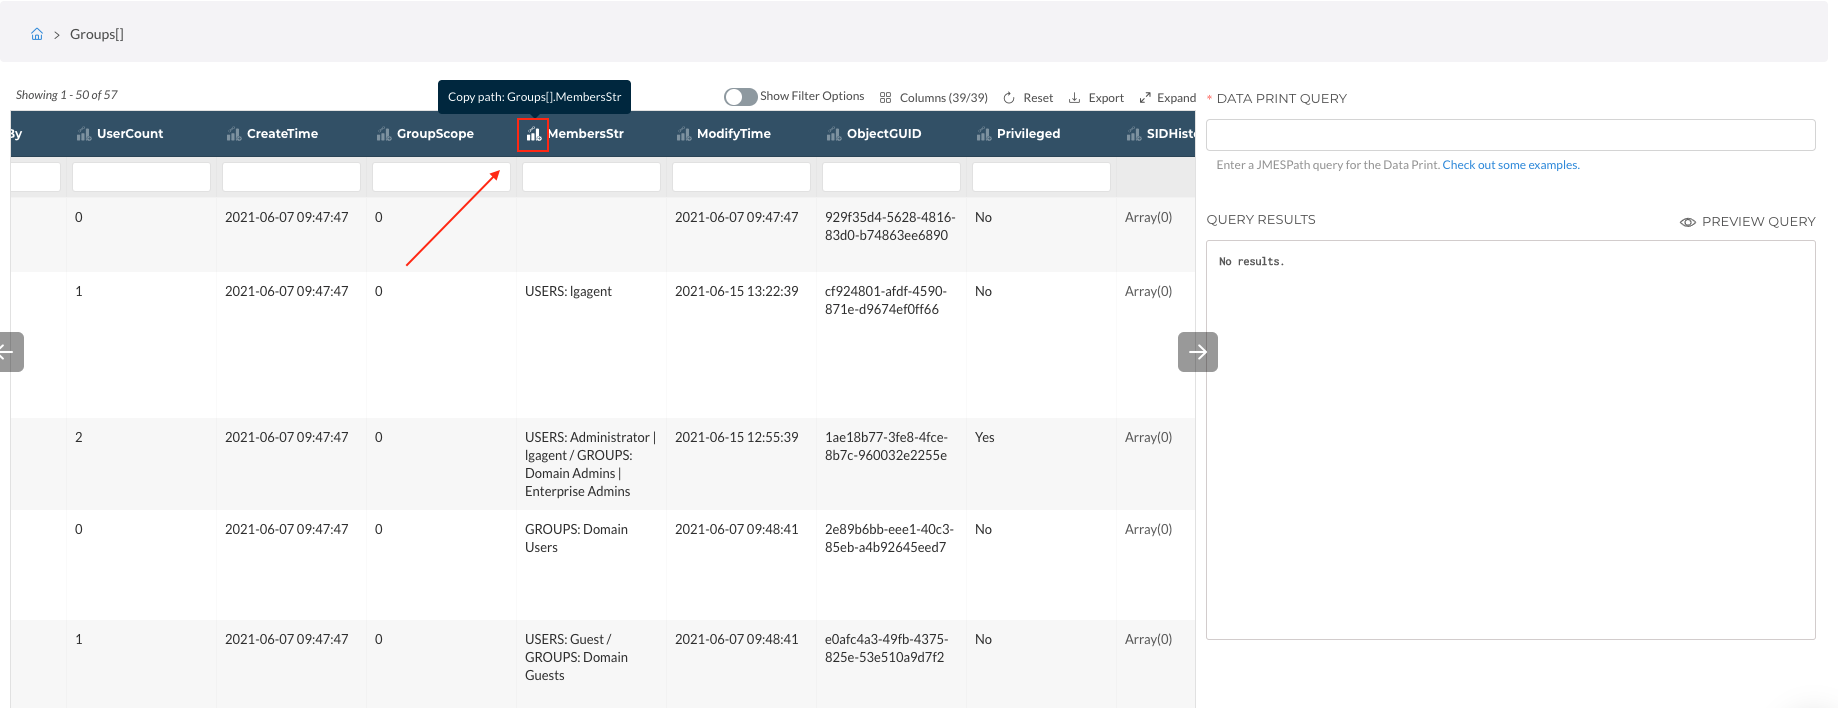
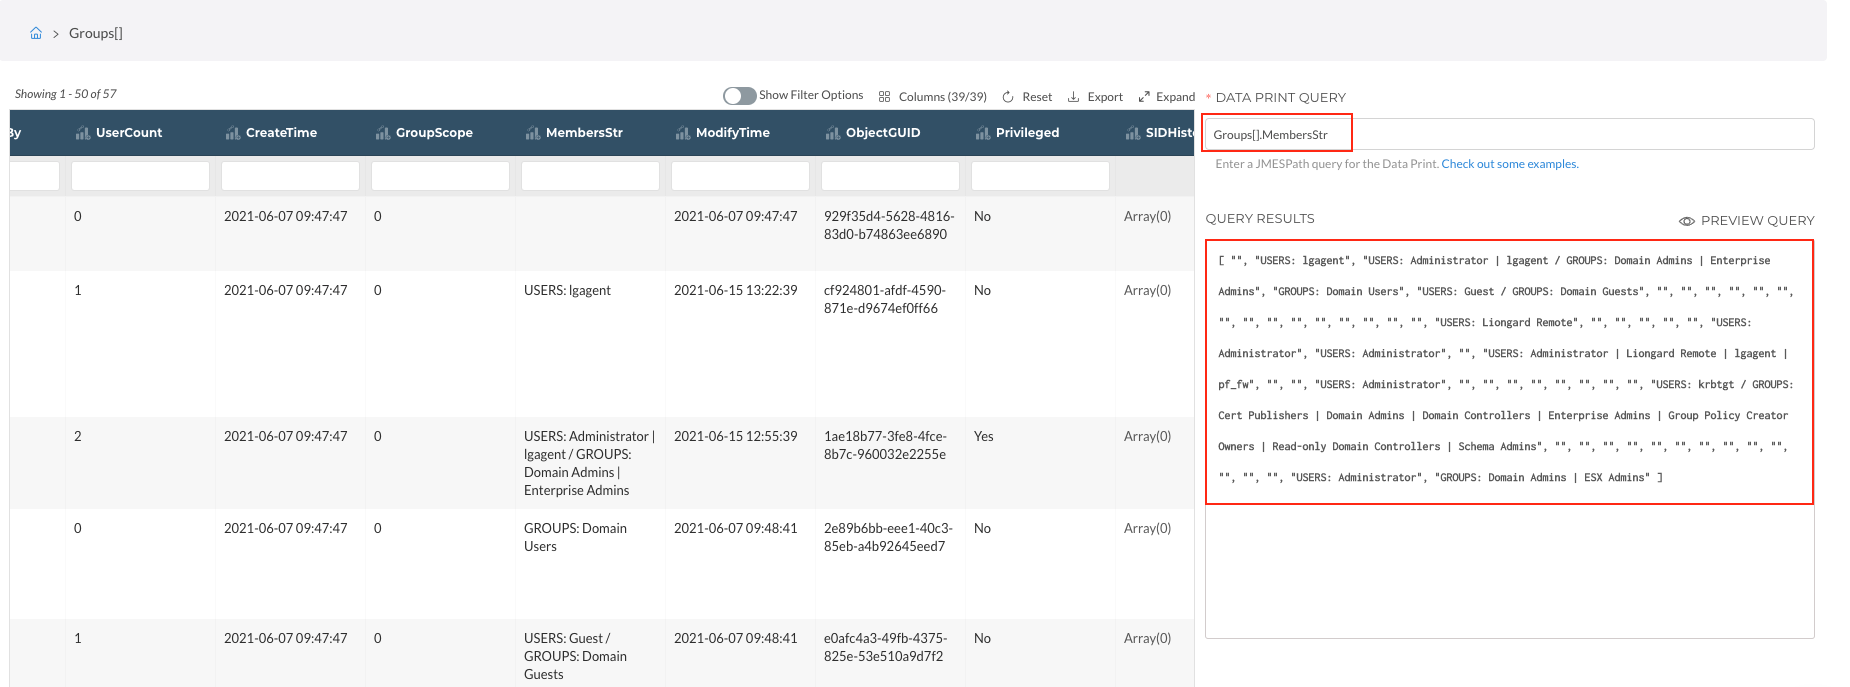
When we paste this query into the Data Print Query field, we see ALL MembersStr data returned. Do know when copying queries from the Data Print Explorer, it WILL NOT include any filtering.
To learn how to use filters and how to further hone in on data when building a Metric, please review our How to Write a Metric documentation.
For this particular example, our final query would be:
Updated 5 months ago
