HunterX Risk Assessment Report
The HunterX Risk Report provides a structured, executive-ready quantification of an organization’s cyber risk exposure, along with the details to back it up. It combines financial risk modeling, historical threat context, and technical exposure analysis into a single report designed to support:
- Executive decision-making
- Cyber insurance conversations
- MSP advisory engagements
- Risk reduction planning
This page explains each section of the report and what it communicates.
Report Overview
A HunterX Risk Report includes three primary sections:
- Cyber Risk Quantification (CRQ) – Financial impact modeling
- Risk Exposure – Industry-based ransomware analysis
- Level 1 Report – Technology footprint and risk indicators
Each section builds on the previous one to move from financial impact → industry context → technical drivers of risk.
1. Cyber Risk Quantification (CRQ)
Purpose
The CRQ section translates cyber risk into financial impact estimates, helping organizations understand:
“If we experience a cyber event, what could it cost us?”
Key Metrics Explained

Annual Revenue
Used as the financial baseline for modeling impact.
Overall Risk / Odds
Probability of a cyber incident occurring within the modeled period.
Exposure Rate
Estimated percentage of revenue at risk if an incident occurs.
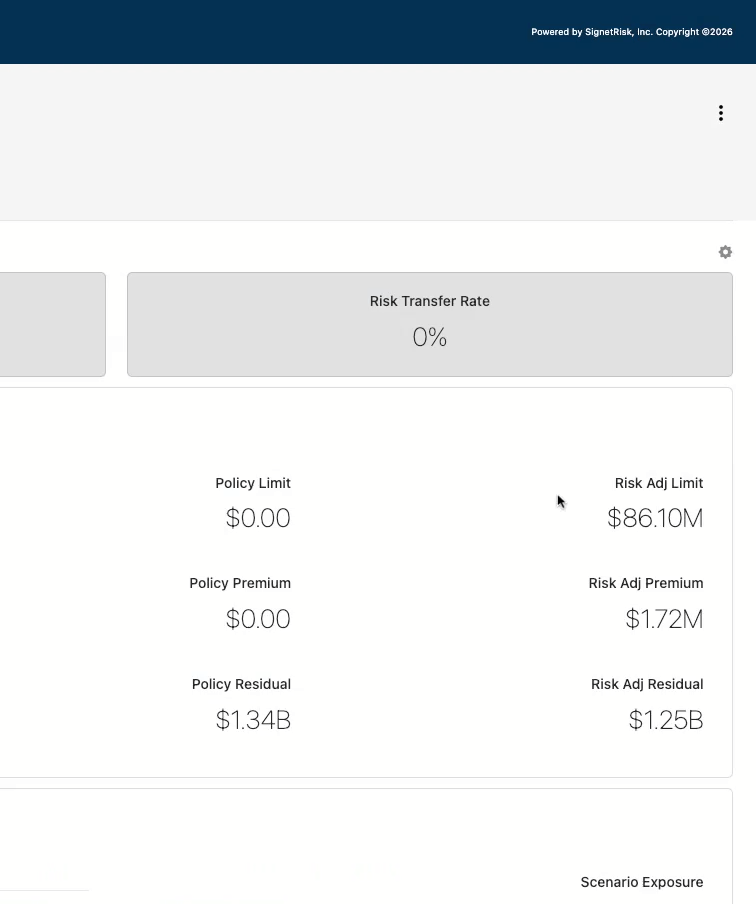
Risk Transfer Rate
Percentage of modeled loss covered by insurance.
- Over 100% = Overinsured
- Below 100% = Residual risk remains
Residual Risk
The financial amount not covered by insurance that the organization would need to absorb.
Five Cyber Risk Exposure Scenarios
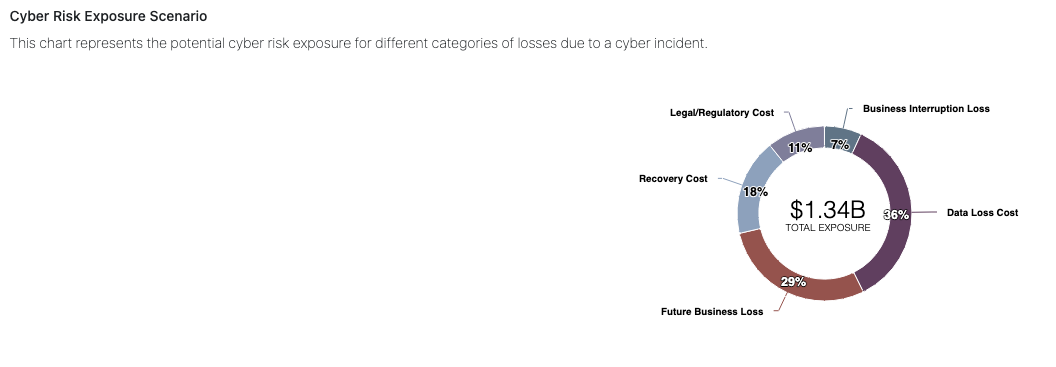
CRQ models financial impact across five common cyber loss categories:
- Business Interruption Loss – Revenue lost during downtime
- Data Loss Cost – Costs related to stolen or exposed data
- Future Business Loss – Reputational damage impact
- Recovery Costs – Infrastructure and system restoration
- Legal / Regulatory Costs – Compliance penalties and legal fees
Each scenario is configurable to reflect the organization’s real-world conditions.
95th Percentile & Insurance Adequacy
The report includes probability modeling (bell curve distribution) for each scenario.
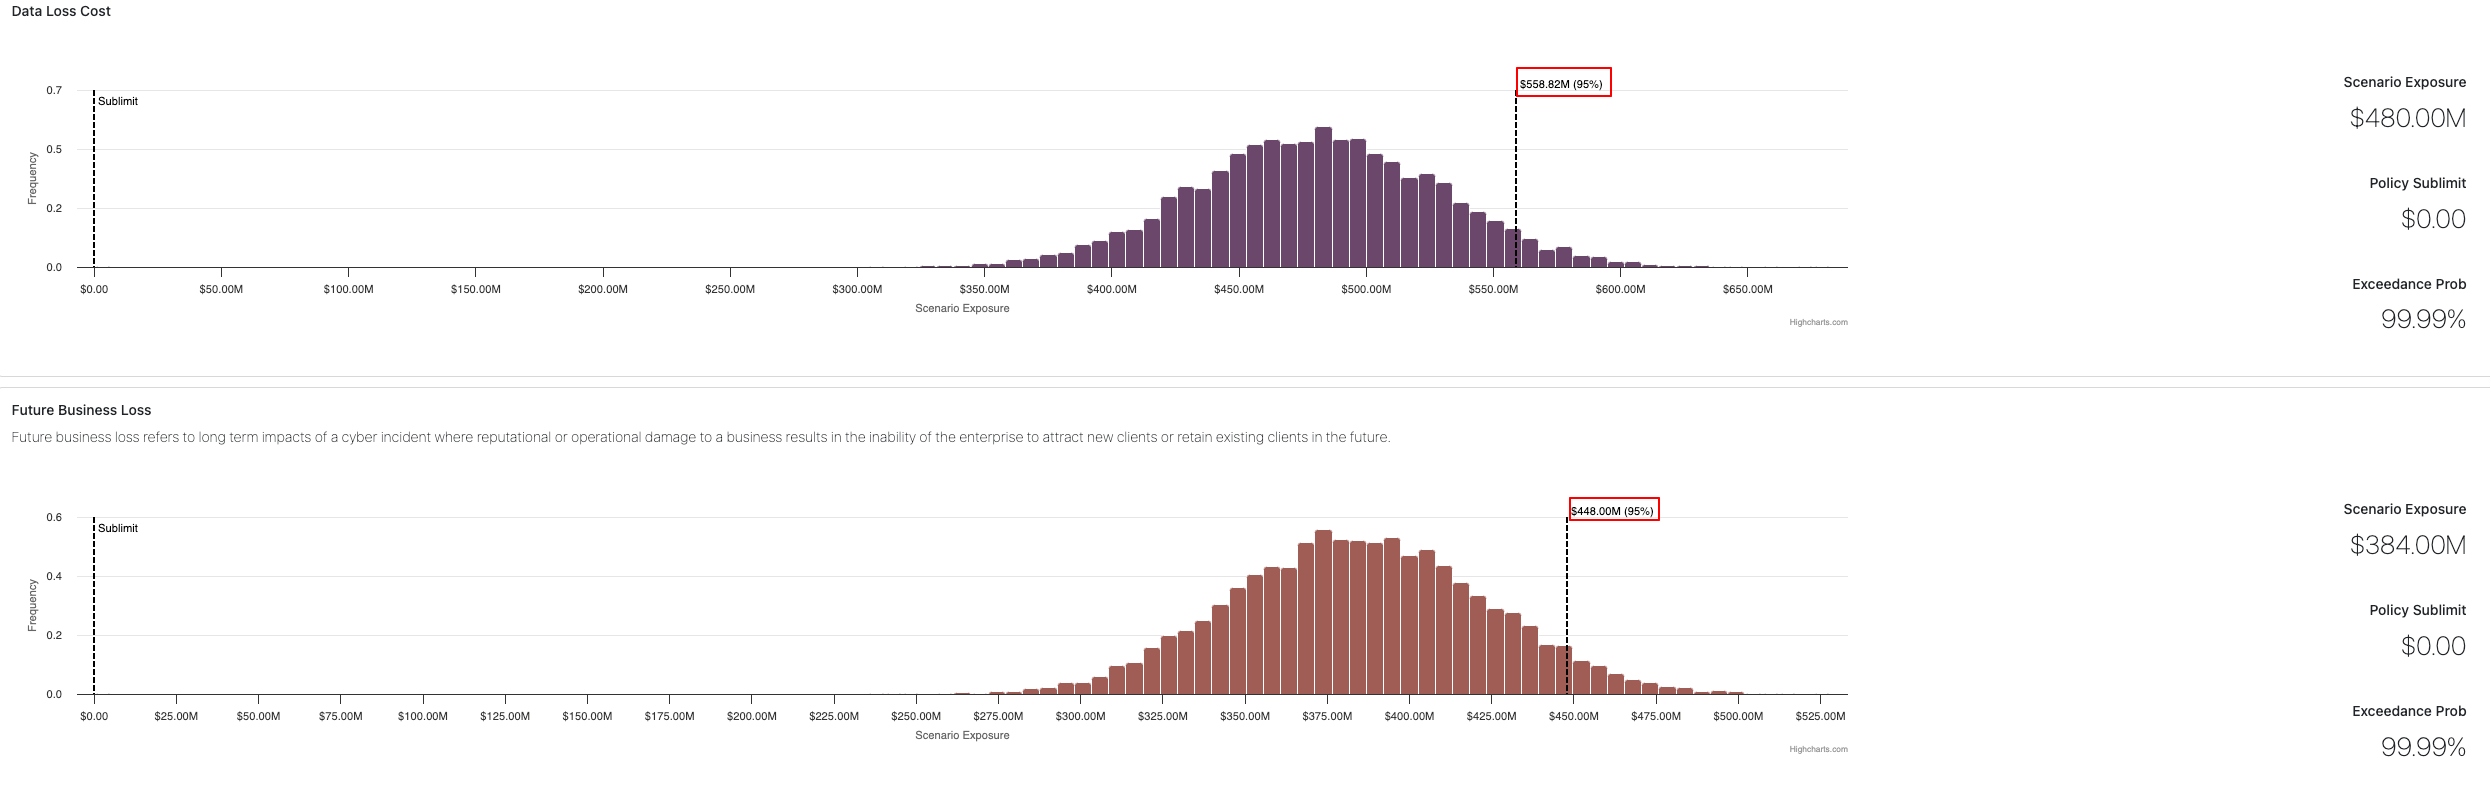
The 95th percentile represents a recommended coverage benchmark — indicating the level at which insurance would cover losses in 95% of modeled cases.
This helps determine:
- Whether policy limits are adequate
- Whether sublimits are too low
- Whether the organization is overinsured
2. Risk Exposure
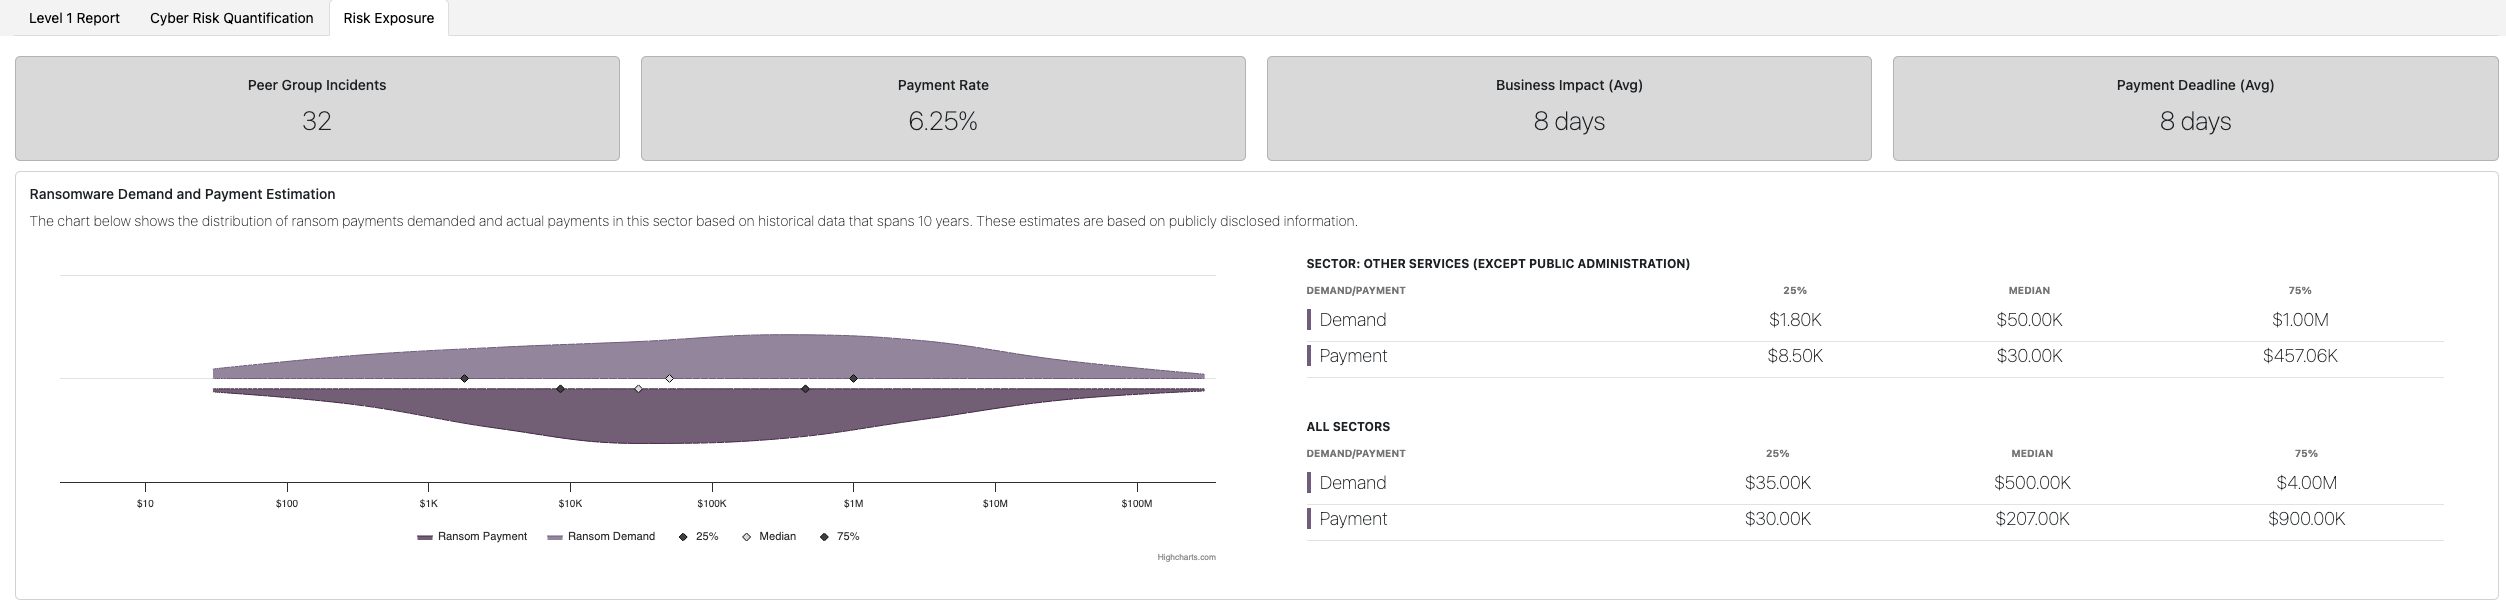
This section provides industry-specific ransomware data to help contextualize financial assumptions.
It answers:
- How often are companies in this sector attacked?
- How long does recovery typically take?
- What ransom amounts are typically demanded?
- What ransom amounts are typically paid?
Industry Comparisons
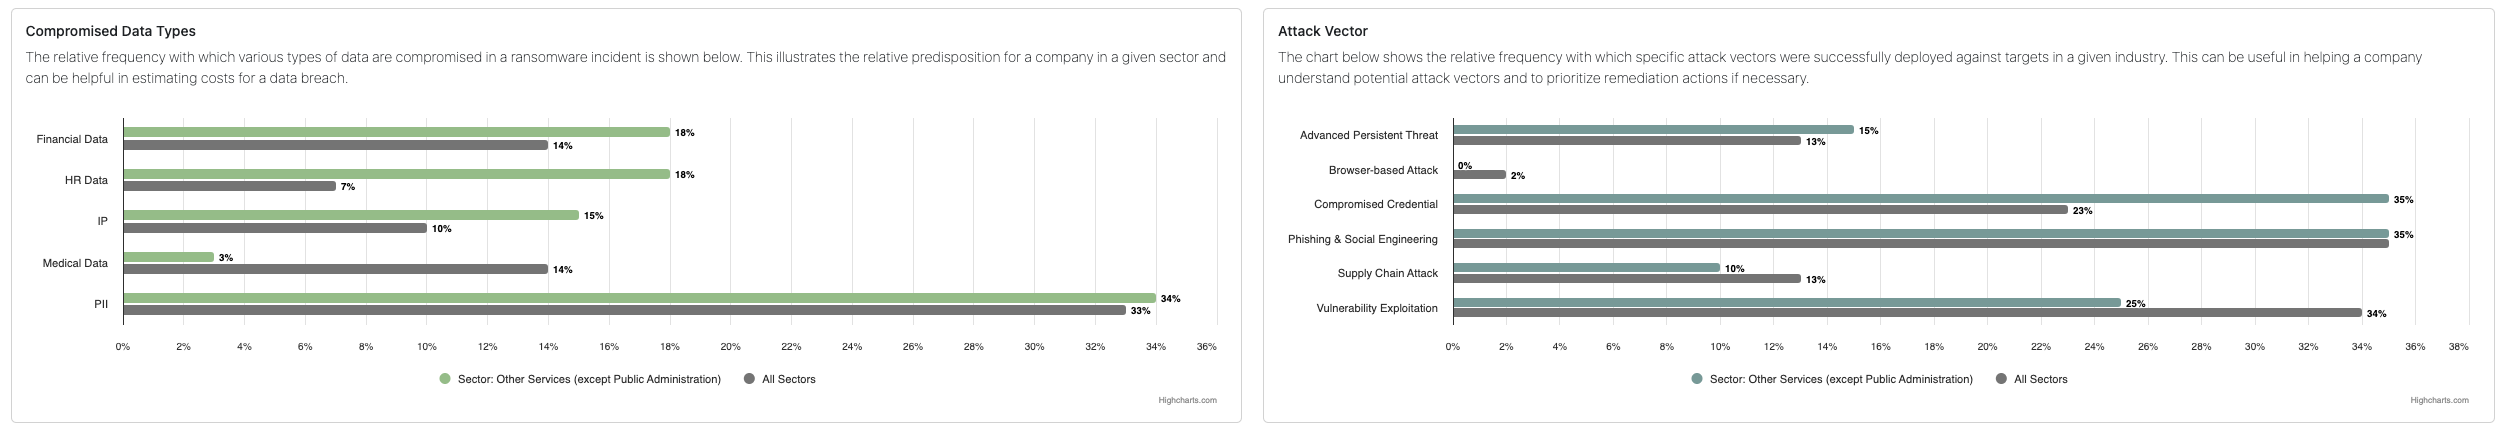
The report compares:
- Sector-specific ransomware demand and payment data
- Median ransom amounts
- Recovery time averages
- Most compromised data types
- Most common attack vectors
Evidence-Based Modeling
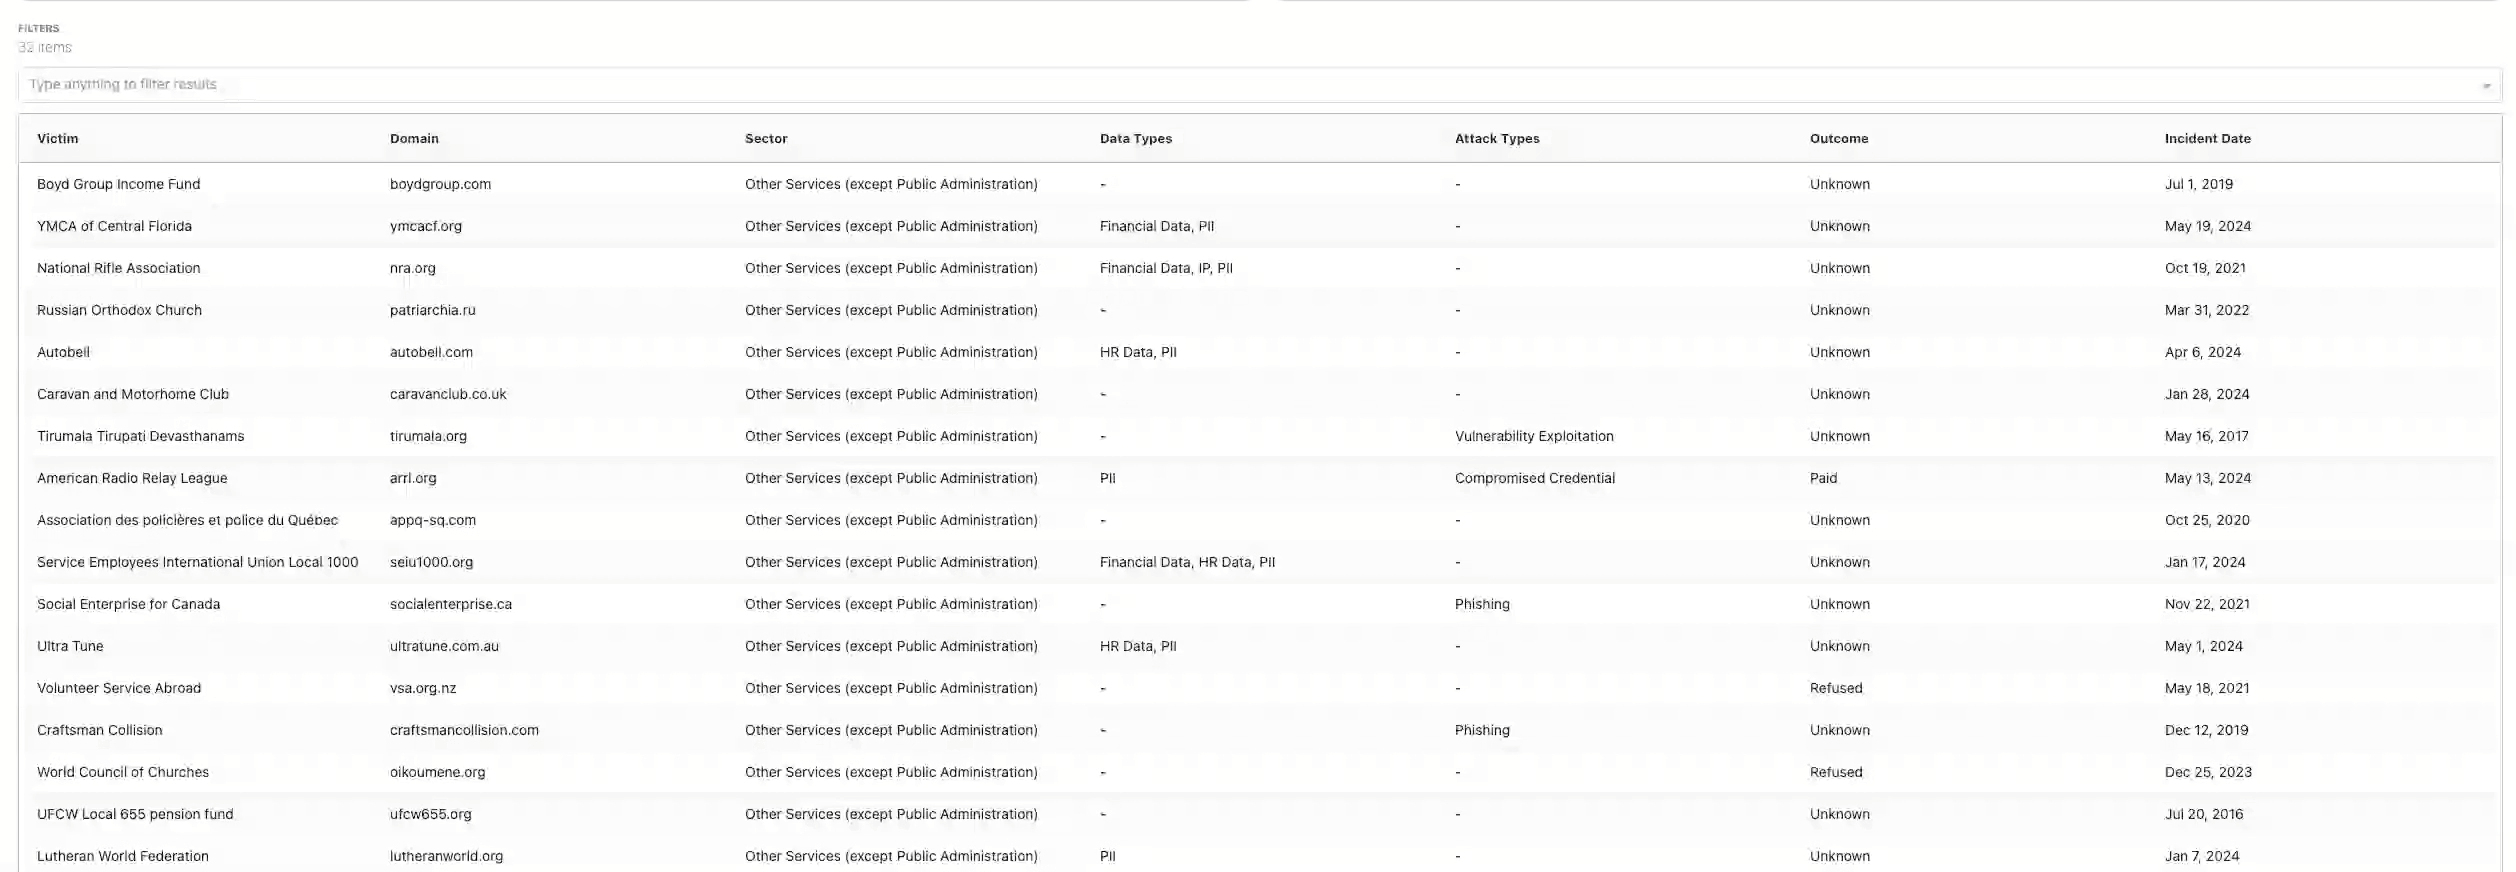
All historical modeling is based on real-world incident data. This supports:
- Credibility in executive discussions
- Data-backed insurance planning
- Risk prioritization decisions
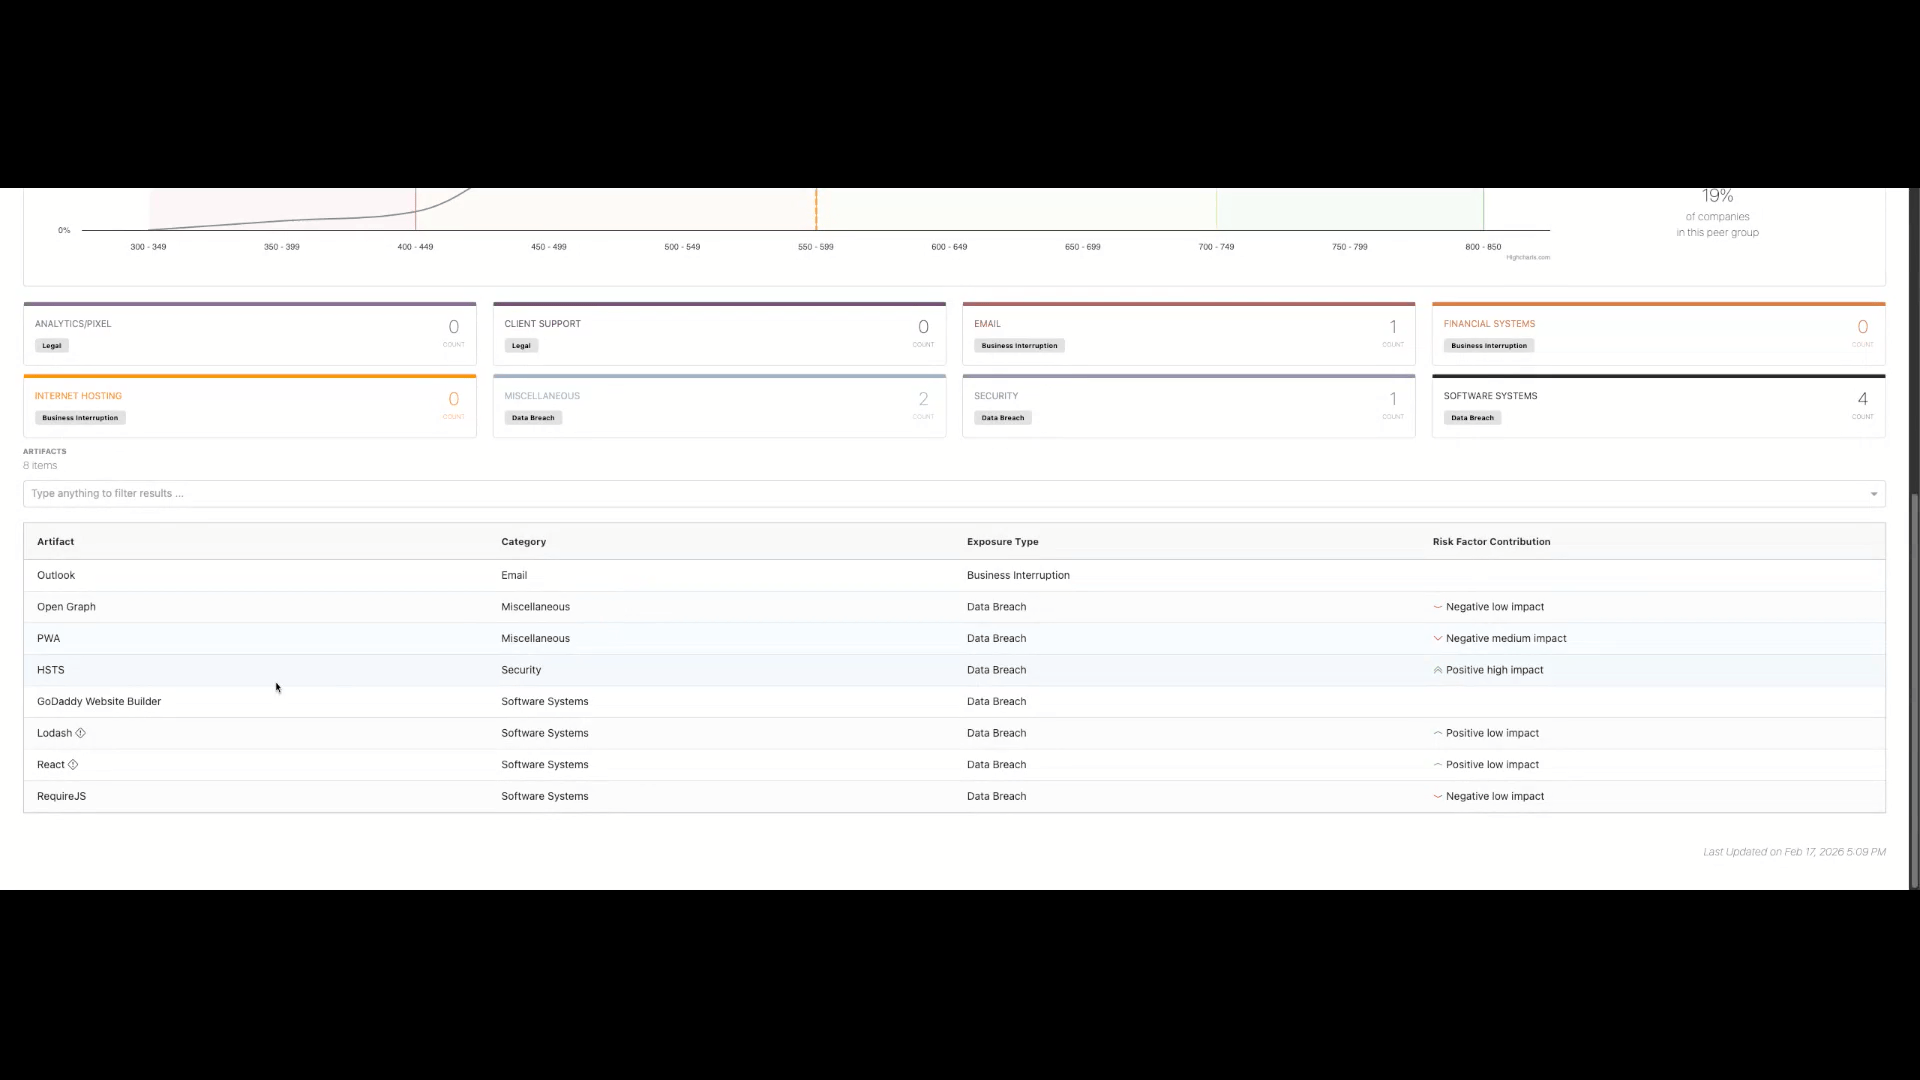
3. Level 1 Report
The Level 1 section analyzes the organization’s externally visible technology footprint.
It evaluates:
- Website technologies
- Hosting providers
- Analytics tools
- CMS platforms
- Software libraries
- Email configuration (SPF, etc.)
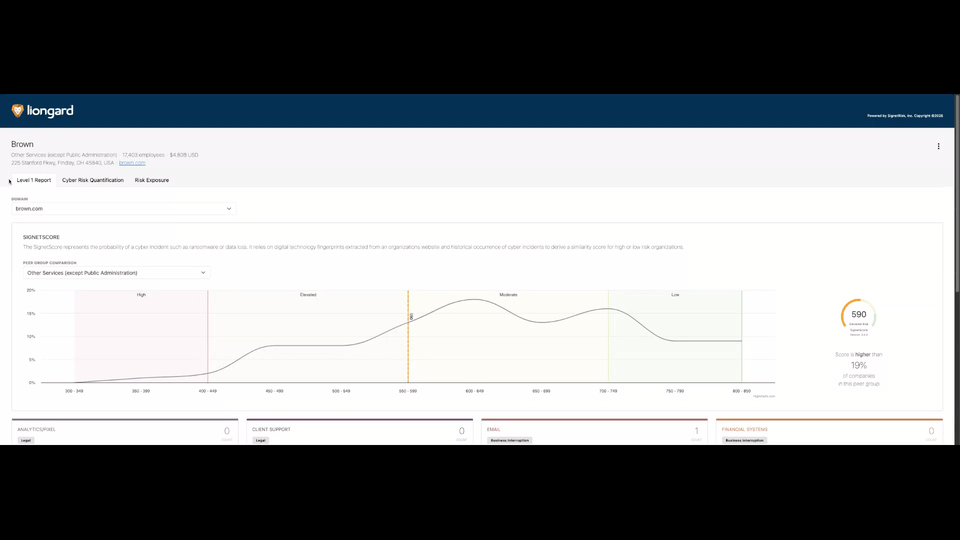
The Signet Score
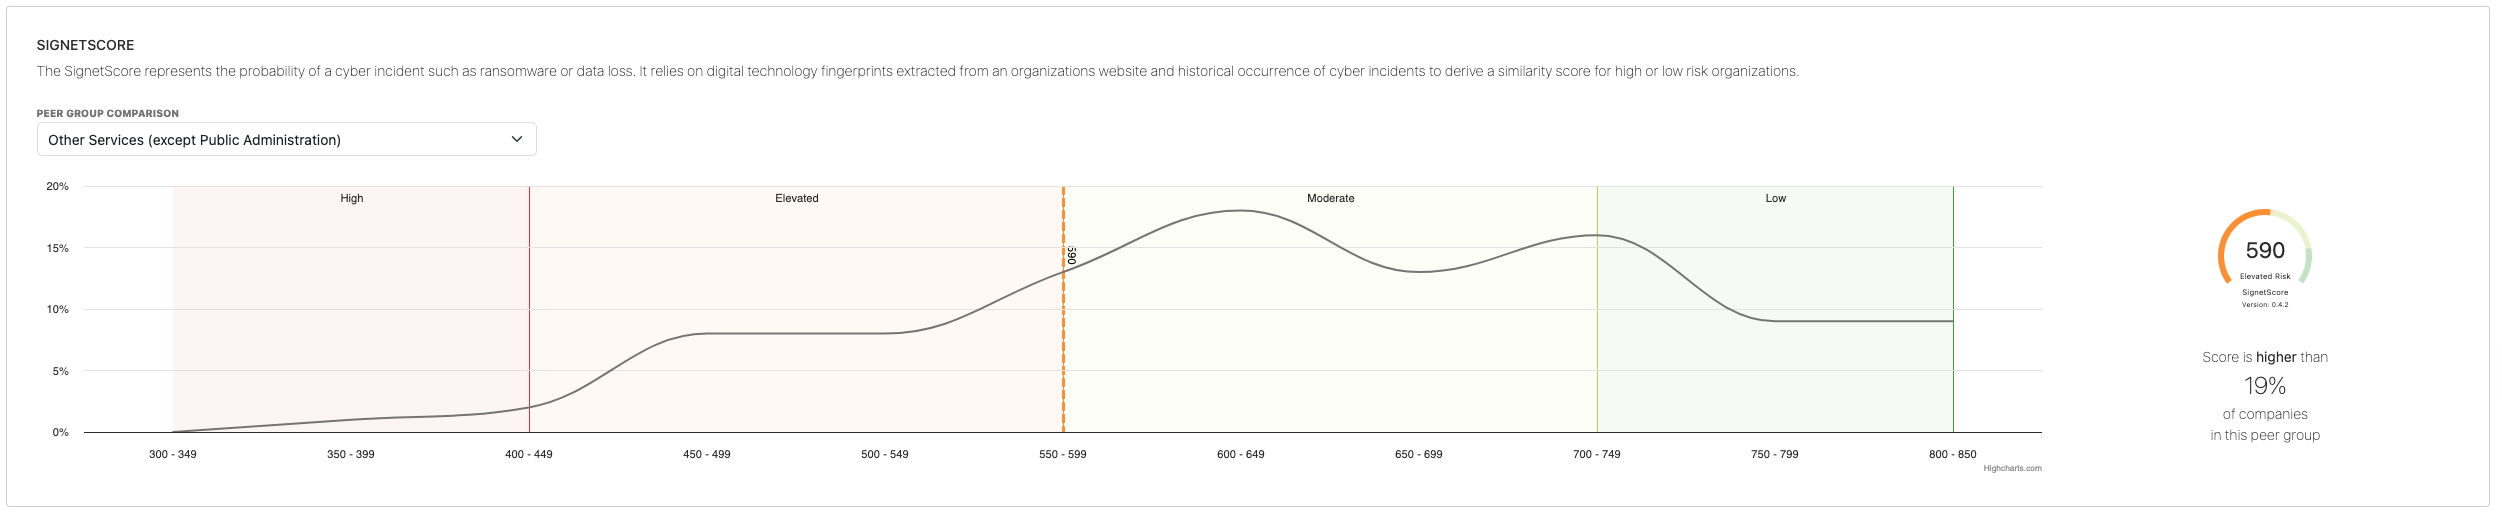
The Signet Score measures how closely an organization’s digital footprint resembles:
- Organizations that have experienced ransomware incidents vs.
- Organizations that have not
The score ranges from:
300 (Higher Risk) → 850 (Lower Risk)
SignetRisk Scoring Scale
The SignetRisk scoring scale is simular a credit score: lower scores indicate higher risk, and higher scores indicate lower risk.
Peer group comparisons show how the organization performs relative to:
- Industry peers
- Companies with prior incidents
- Companies without incidents
Risk Factor Contribution
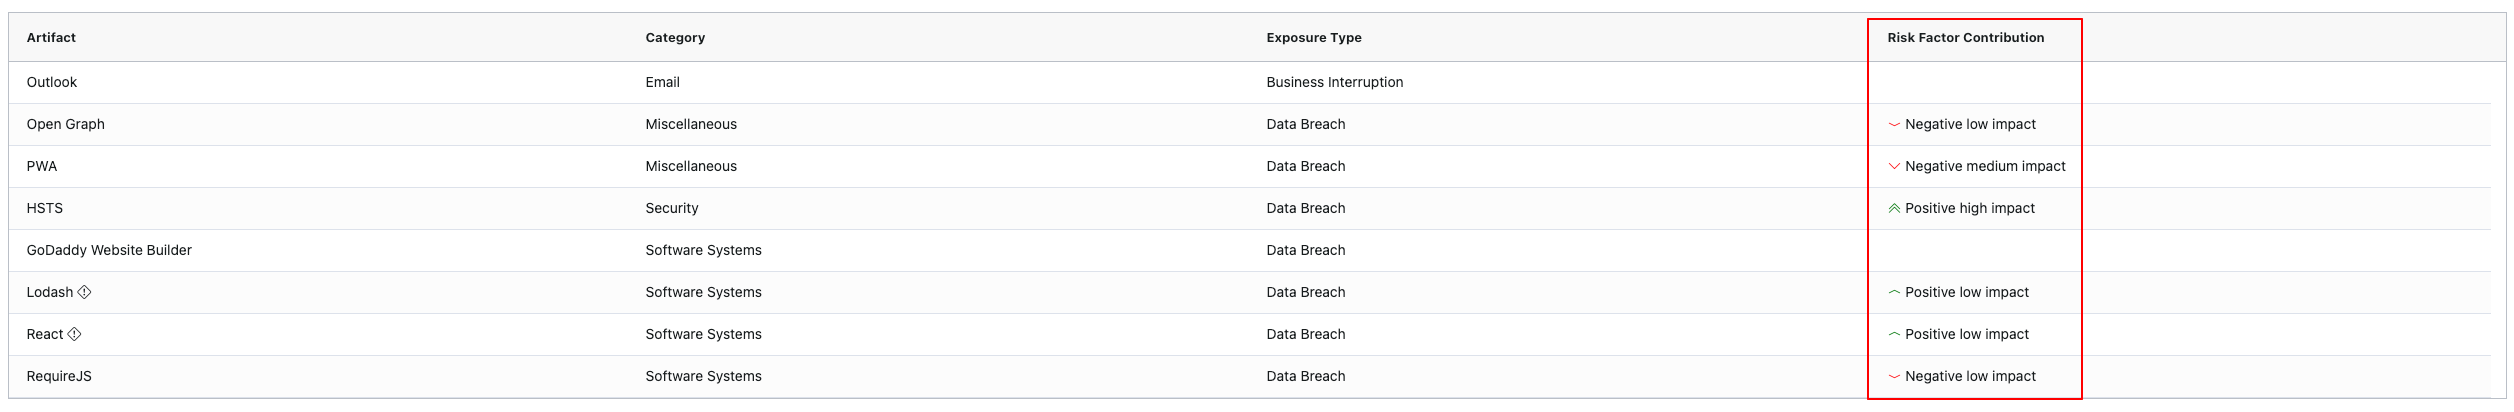
Each detected technology is assessed for its correlation with historical breach data.
Possible indicators:
- Positive Impact – Correlated with lower incident likelihood
- Negative Impact – Correlated with higher incident likelihood
Important!
These indicators are correlation-based, not causation-based.
Exposure Types
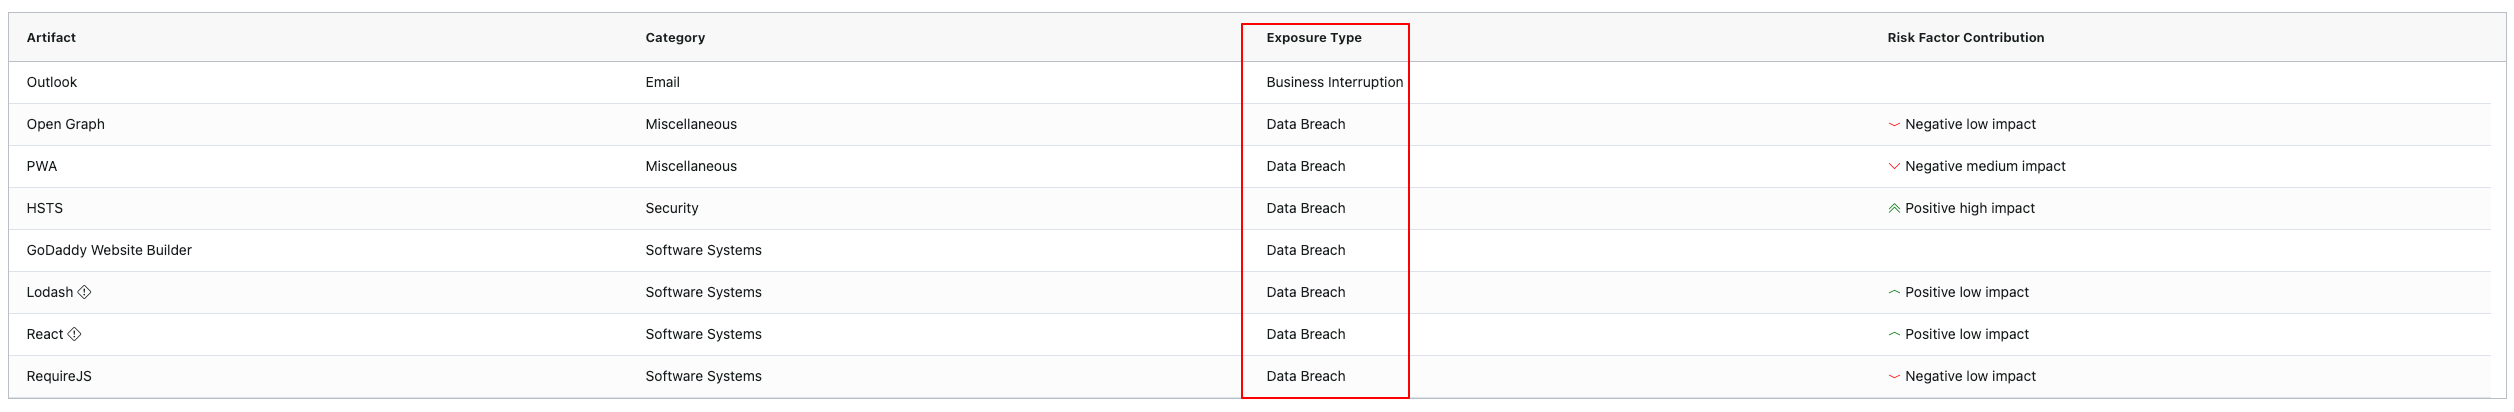
Each finding may indicate potential exposure to:
- Data Breach Risk
- Legal Risk
- Business Interruption Risk
Artifact and Category
This provides the name of the application and its associated category.
Technology Detail & Evidence
Each technology includes:
- Description
- Version comparison
- Category
- Exposure Type
- Risk Factor Contribution
- Security Relevance
- General remediation guidance
Updated about 1 month ago