Single Environment Dashboard
Overview
The Single Environment Dashboard gives partners one place to find all important details for a single Environment, customer, in Liongard. It is designed to give insight into deployed System Inspectors, the Change Detections which have recently been detected, and the Actionable Alerts that have been triggered for that Environment. Partners can also create Environmen-level notes on this screen, and if using ConnectWise, the page can be set up for Billing Reviews.
If the user has Environment Administrator rights, most administrative tasks can also be performed from the Environment Admin tab of this screen.
Single Environment Dashboard
On the Dashboard screen > Envrionments tab, when you click into an individual Environment, you will be directed to the Overview tab of the Single Environment Dashboard.

Overview Tab
Systems
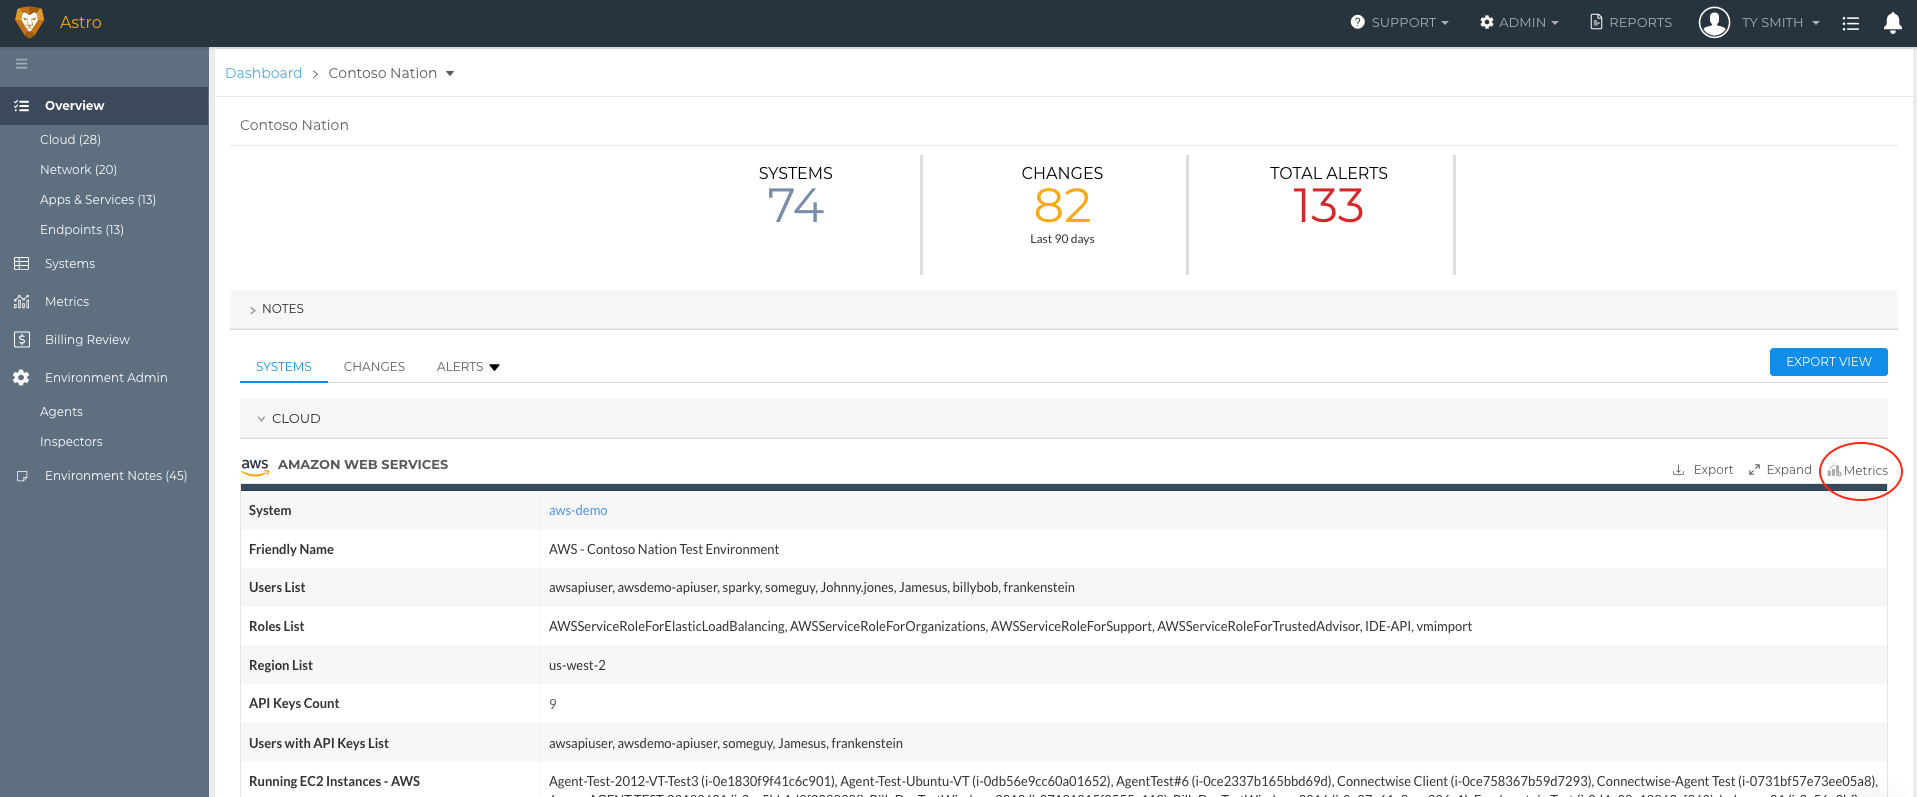
Here you will find an overview of the Environment. You'll find key stats about this Environment as well as a table for each Inspector that has been rolled out for this Environment.
Each Inspector's table can be customized by selecting Metrics you and your team care about. Once the table for an Inspector is customized, the Metrics selected will globally apply across Environments. Clicking the System Name, within these tables, will take you directly to that System Inspector's screen.
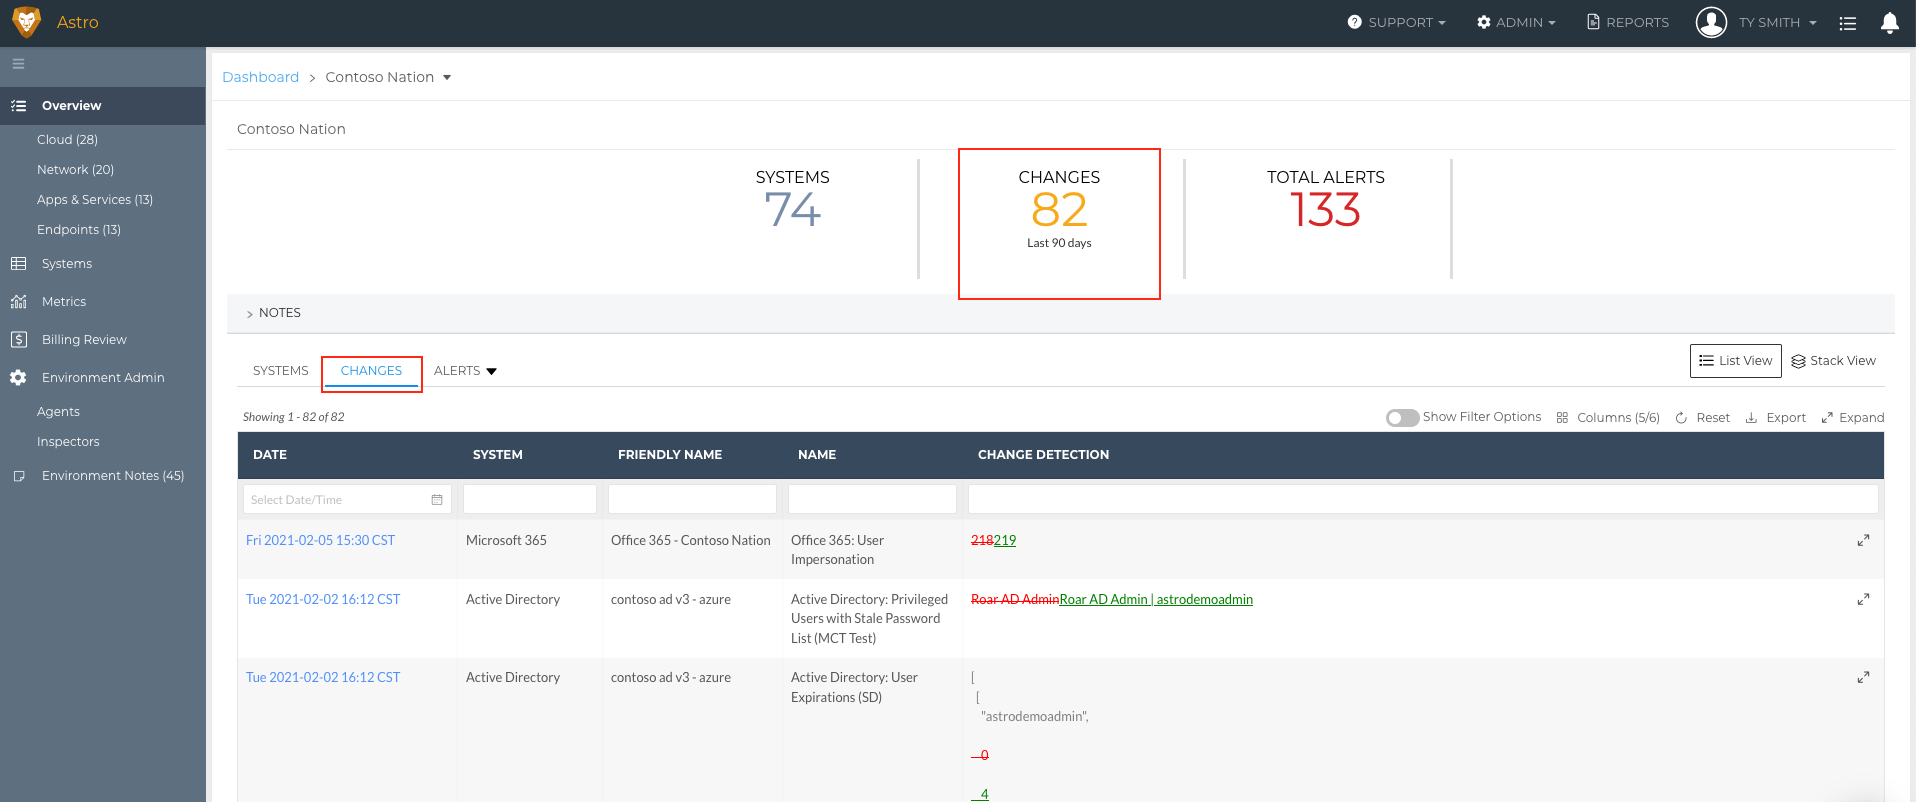
Changes
The Changes tab details the Change Detections, for System Inspectors, captured for this Environment in the last 90 days.
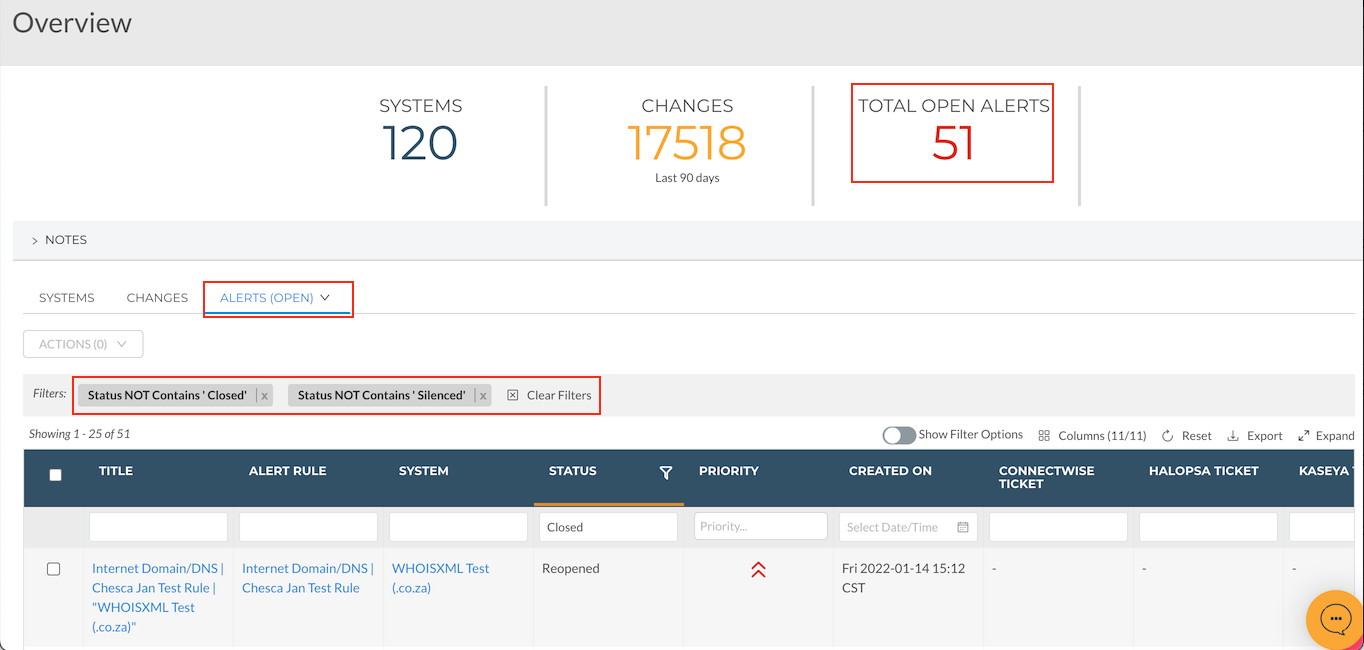
Total Open Alerts
In the Total Open Alerts tab, you will see all the open Actionable Alerts that have been generated for this Environment.
To see all existing Actionable Alerts, remove the filters above the table or select the "All Alerts" dropdown within the "Total Open Alerts" tab.
Systems Tab
Here you'll find a list of all of the Inspectors deployed for the Environment. The table includes the last inspection date, along with the Actionable Alerts that are open and closed for each system. Clicking the Friendly Name of an Inspector will take you directly to that System Inspector's screen.

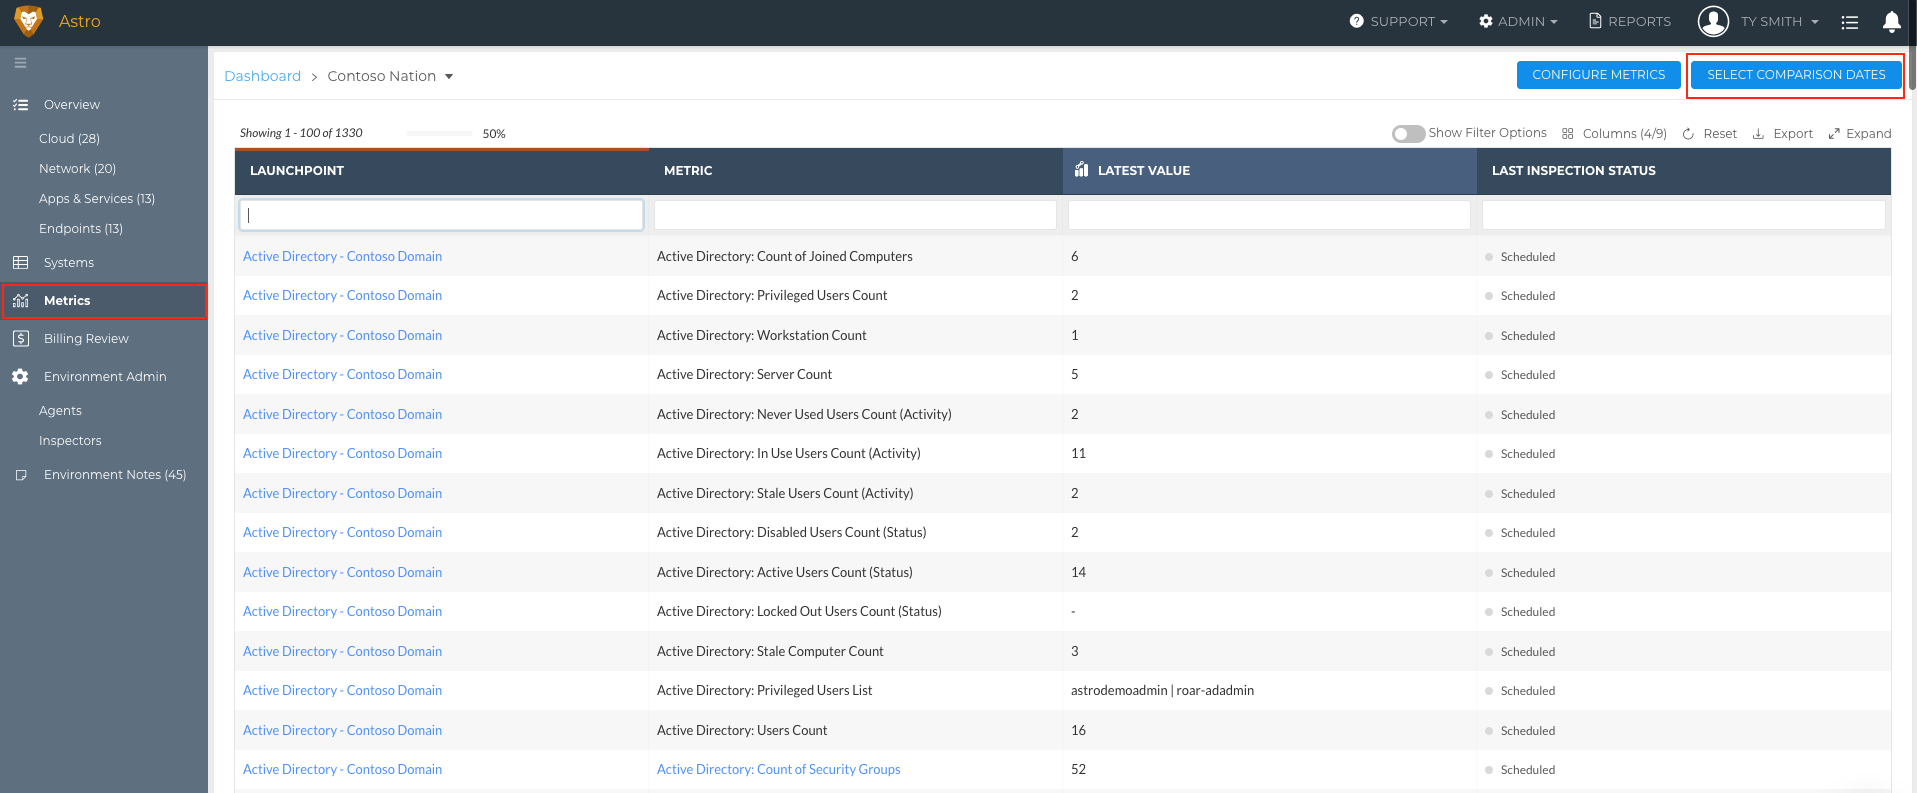
Metrics Tab
Here you will find all Metrics, enabled to display, across all deployed Inspectors. Metrics can be enabled to display in the Admin > Metrics screen. On this screen, you can also compare the latest Metric query result against two other dates by selecting Select Comparison Dates in the top right corner of the page.
Environment Admin
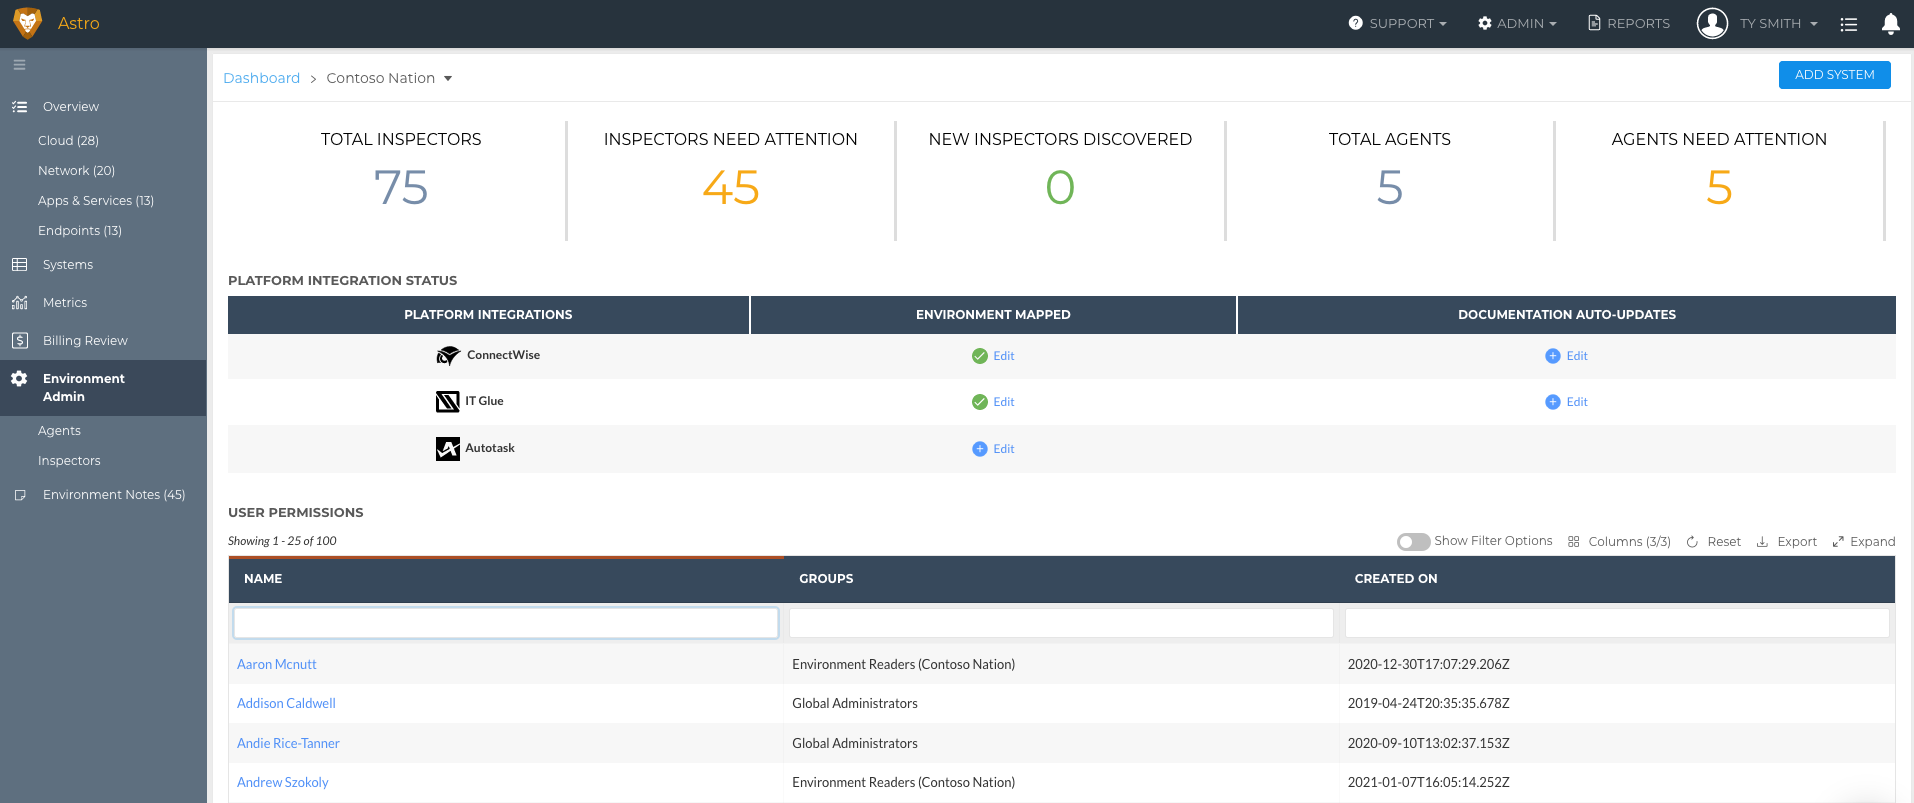
This tab will give you detailed information on the Environment, including Inspectors that need attention, newly Discovered Inspectors, Agent details, Platform Integration status, and assigned User Permissions. Depending on your permissions some of this information, such as integration status, may not appear in your view.
This screen is incredibly valuable as you onboard a new customer in Liongard.
Additional details on Agents and Inspectors for the Environment can be found by clicking the corresponding sub menus.
Environment Notes
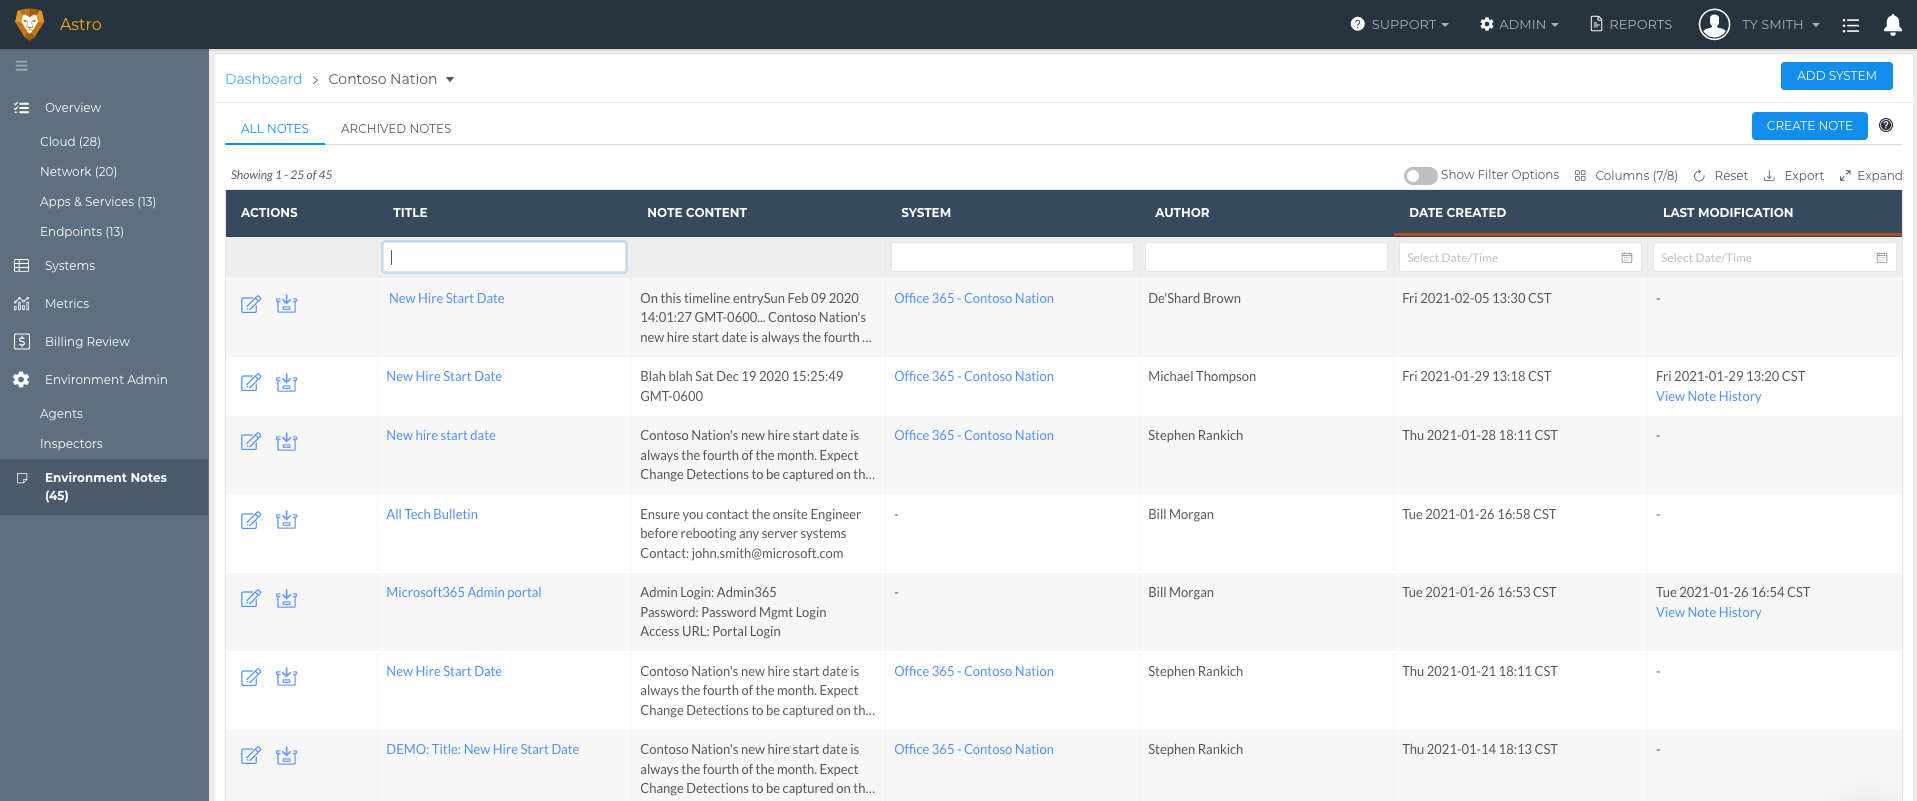
Environment-level notes can be created and viewed on this tab. For more information aboutNotes, please see our Notes documentation.
Updated 7 months ago
