Metrics
Liongard AcademyLearn more about Metrics with Liongard Academy's "Get to Data Faster with Liongard's Metrics and Reports" course.
Access today at Liongard Academy.
Overview
Metrics unlock Liongard's data. Metrics are queries into an Inspector's Data Print to extract specific pieces of data. Once enabled, Metrics will display across your Liongard platform helping your team get to data faster.
Metrics are the foundation of Liongard's Change Detections and Actionable Alerts. Metrics are also used in Liongard's Reports.
Understanding Metrics
In its raw form, an Inspector's Data Print lands in Liongard as a JSON Object. Using JMESPath, a query language of JSON, you can write Metrics in Liongard in multiple ways. Learn How to Write a Metric here.
By default, Liongard enables select Metrics to auto-display in your platform. To display additional Metrics in your platform, navigate to Admin > Metrics. Then, toggle the Display toggles on according to your preference. Once enabled, Metrics can also be used in our third-party integrations, like [BrightGauge] (https://docs.liongard.com/docs/brightgauge-integration) and Power BI.
Metrics are not pushed to your PSA or Documentation Tool integrations.
Metrics Library
To view all of Liongard's prewritten Metrics as well as Metrics written by your team, in your instance navigate to Admin > Metrics. Custom Metrics can be shared in the Liongard Library. See our documentation here.
For Metrics to display in Liongard, they must be enabled to display.
On this screen, you can also write your own Metric using our Metric Builder. Review our documentation on How to Write a Metric to learn more.
Recently Added MetricsWhen a new Metric is added in Liongard, it will be highlighted in green for 30 days. If you would like to sort your Metrics table by newly added Metrics, in the Columns drop-down, add the "Created On" column.

Metric Size Limit
The data Liongard Metrics return cannot exceed 2 Mb. When a Metric returns a value larger than 2 Mb, an error message will display.
What can Metrics do for your team?
Metrics can help your team:
- Isolate Data from an Inspector's Data Print
- Monitor Change in Systems with Liongard's Change Detections
- Standardize your Customer Support with Liongard's Actionable Alerts
- Report on the Data you and your Team Care Most About
- Leverage Metrics in Third-Party Integrations
Isolate Data from an Inspector's Data Print
Our Inspectors often pull vast amounts of data. Because of this, we work to surface only what will be valuable to our partners into each Inspectors' different Data Views. However, the full set of data that each of our Inspectors brings back can be found in each Inspectors' Data Print tab.

If we pull the data back through an Inspector but do not surface it in one of our Inspectors' Data Views, it can still be surfaced in your Liongard platform through a Metric. To learn how to write a Metric, please review our How to Write a Metric documentation.
Explore Metrics
Once a Metric is enabled to display in Liongard, you can find the Metrics output in four places:
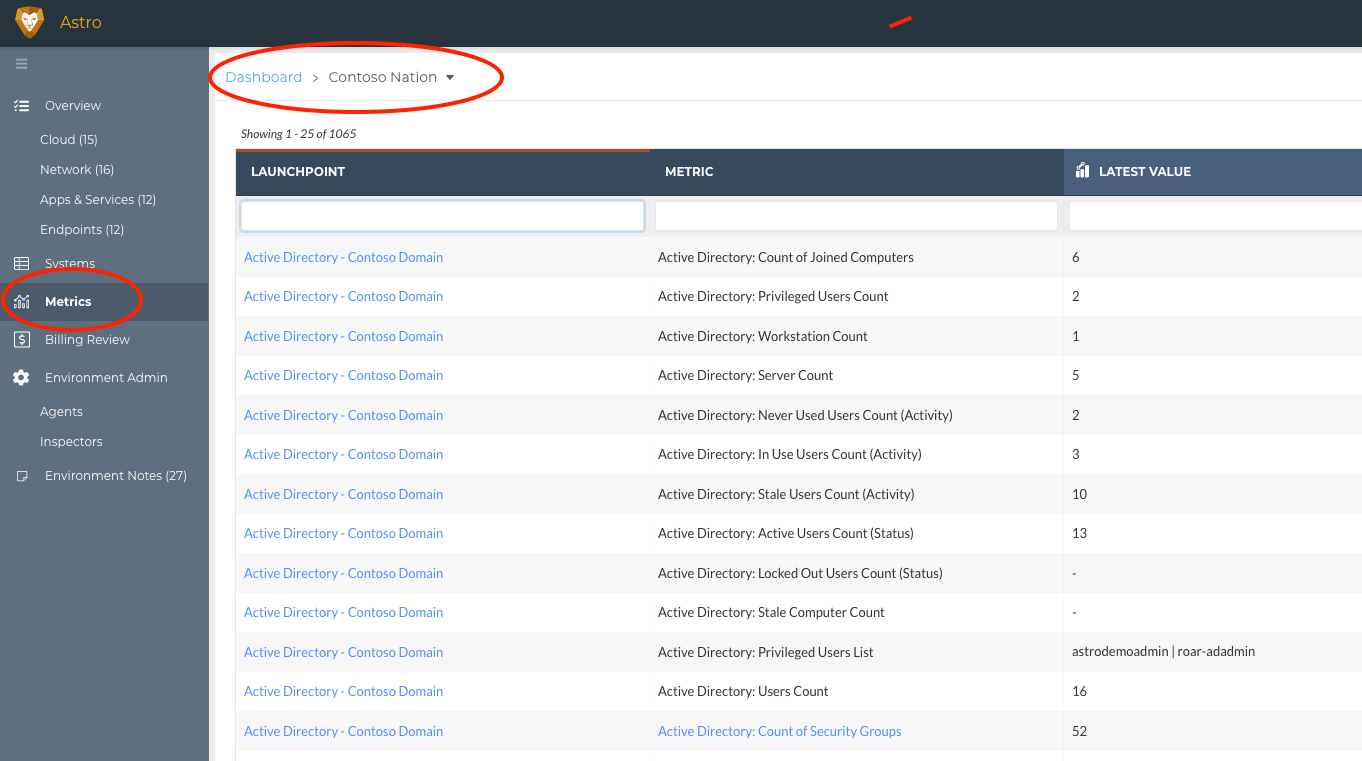
- In Liongard, navigate to your Dashboard > Select an Environment > Select the Metrics tab. Here you can see all Metrics (that are enabled to display) across all Inspectors for the selected Environment.
This screen is powerful as you and your team prepare for customer meetings.
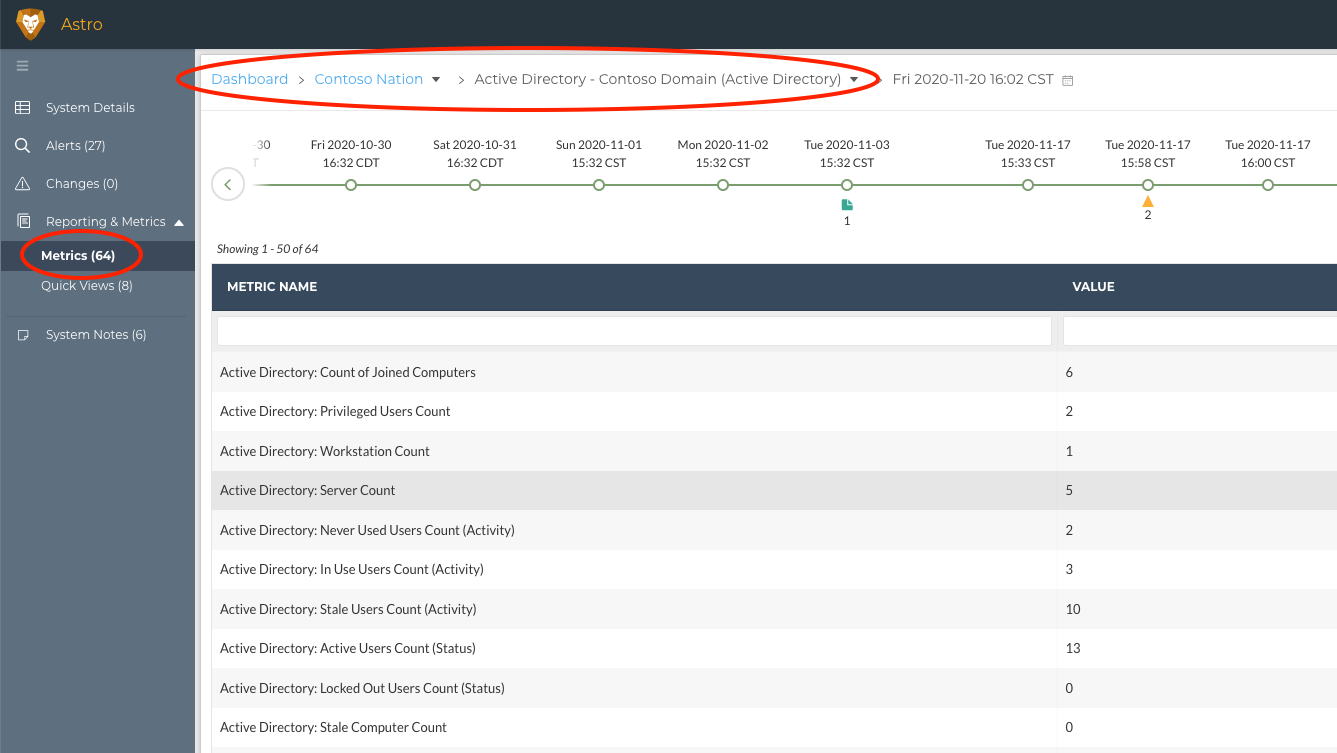
- In Liongard, navigate to Admin > Inspectors > select an Inspector > select a Friendly Name > select the Metrics tab. Here you can see all Metrics (enabled to display) for the selected Inspector and Environment.
This screen is powerful when a customer calls with a question about one of their systems/tools.
- In Liongard, navigate to your Dashboard > select a System Inspector Type > select the Metrics tab. Then select the Metrics (enabled to display) you would like displayed on this page using Select Metrics in the top right corner of the page as shown below.
This screen is powerful when you are trying to look at data for one system, across your customers.

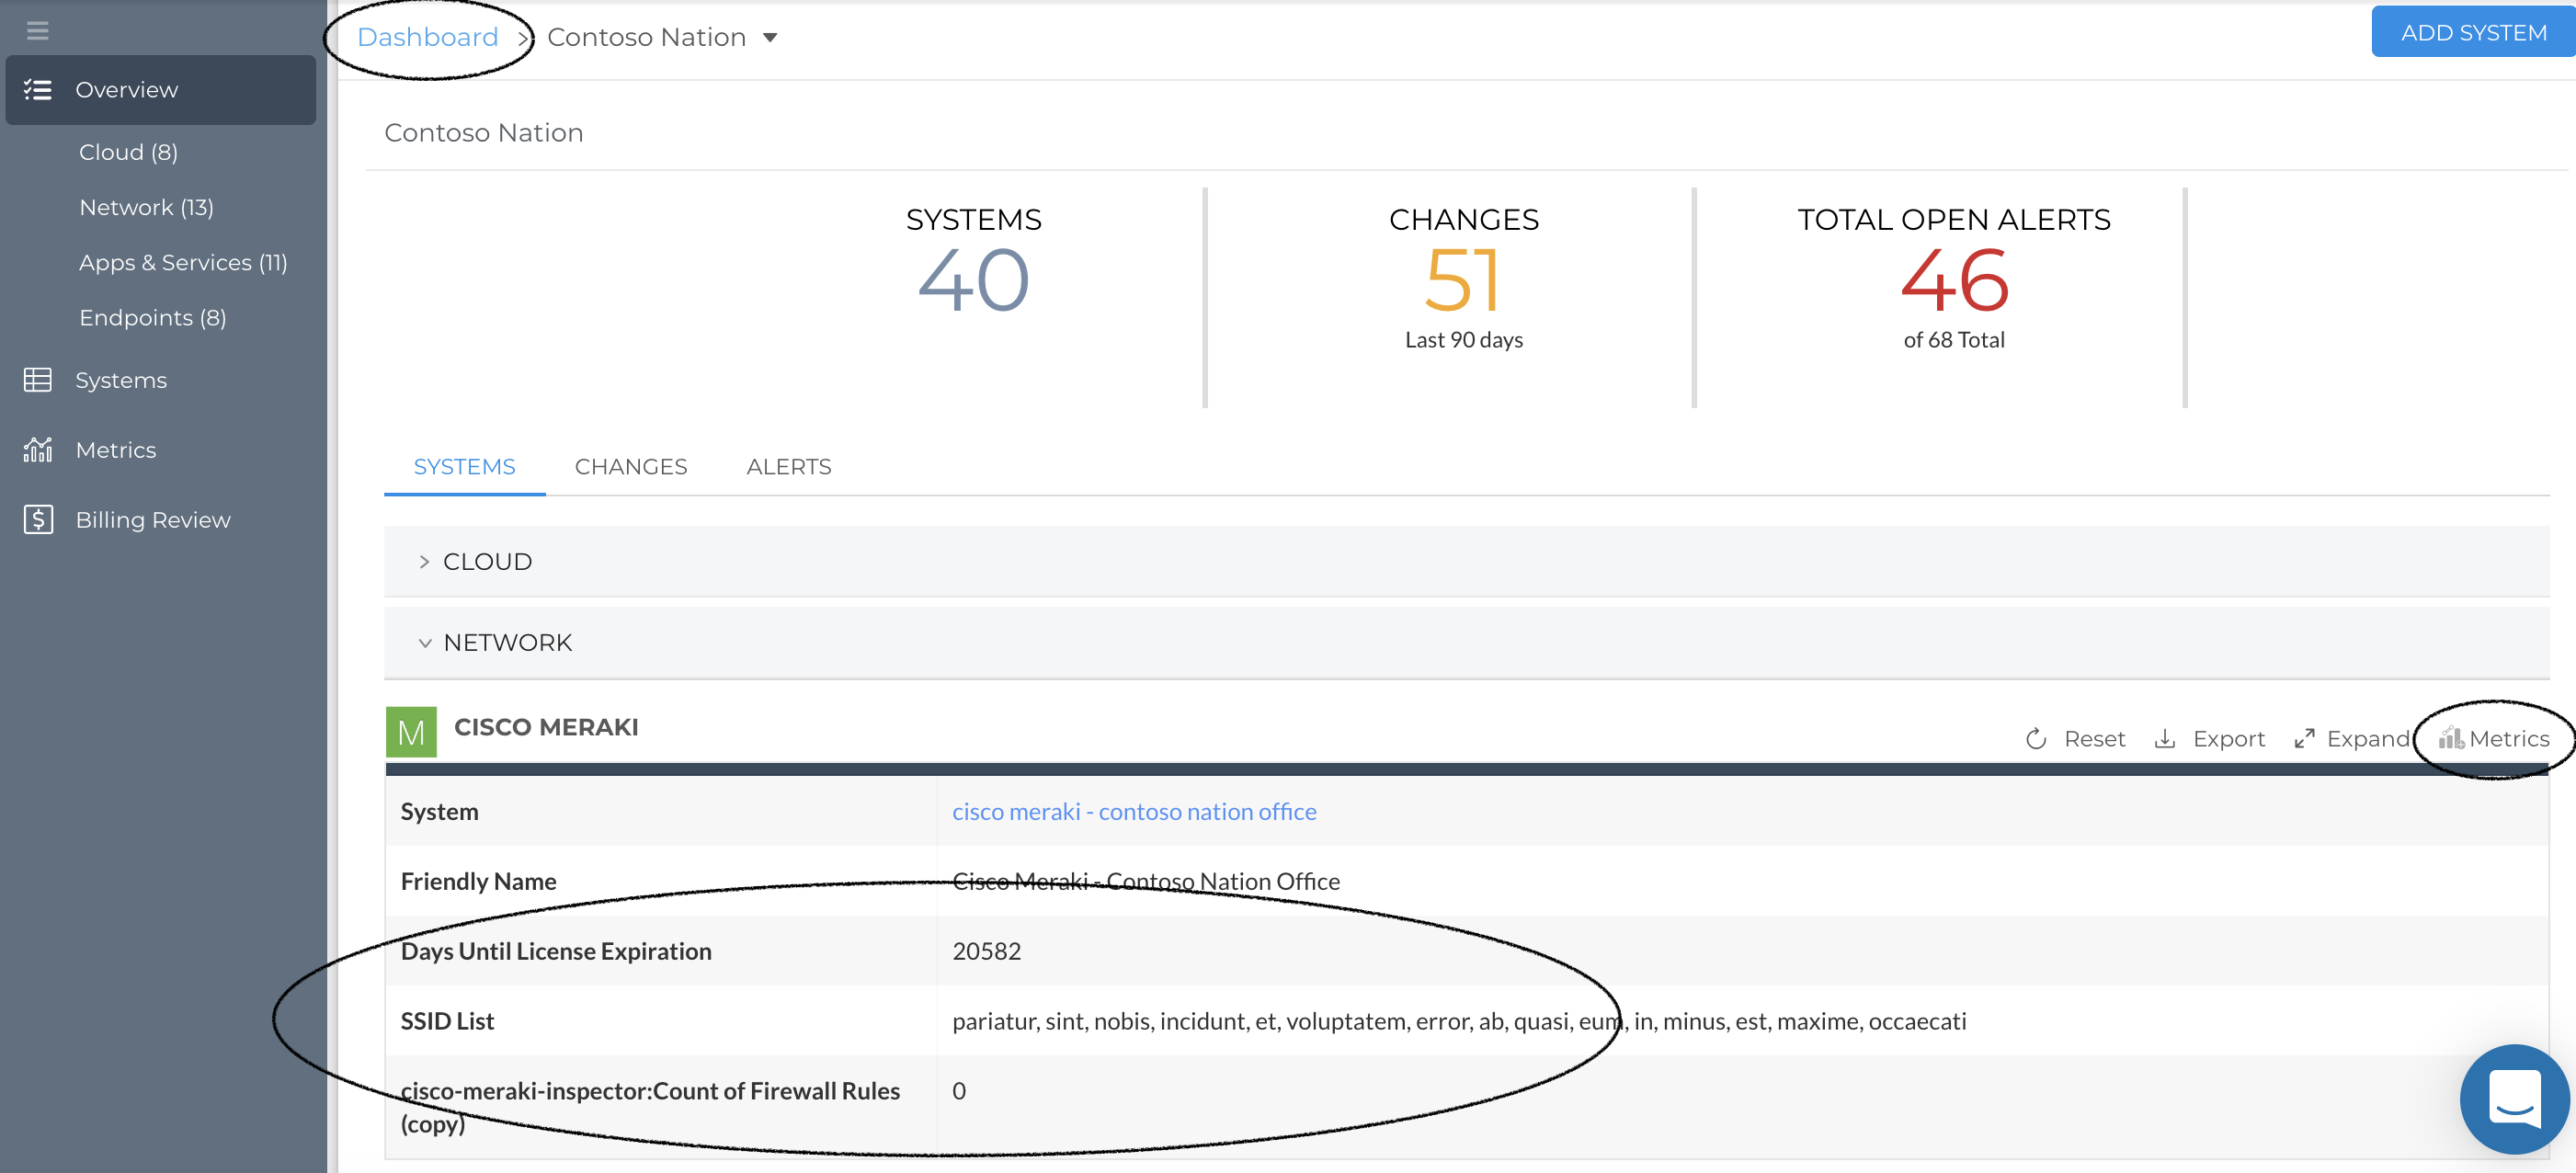
- In Liongard, navigate to your Dashboard > Select an Environment. This takes you to a Single Environment Dashboard Screen. Here you can see Metrics that have been globally selected across all Environments for each System.
For more information on this screen, please review our Single Environment Dashboard documentation.
Monitor Change in Systems with Liongard's Change Detections
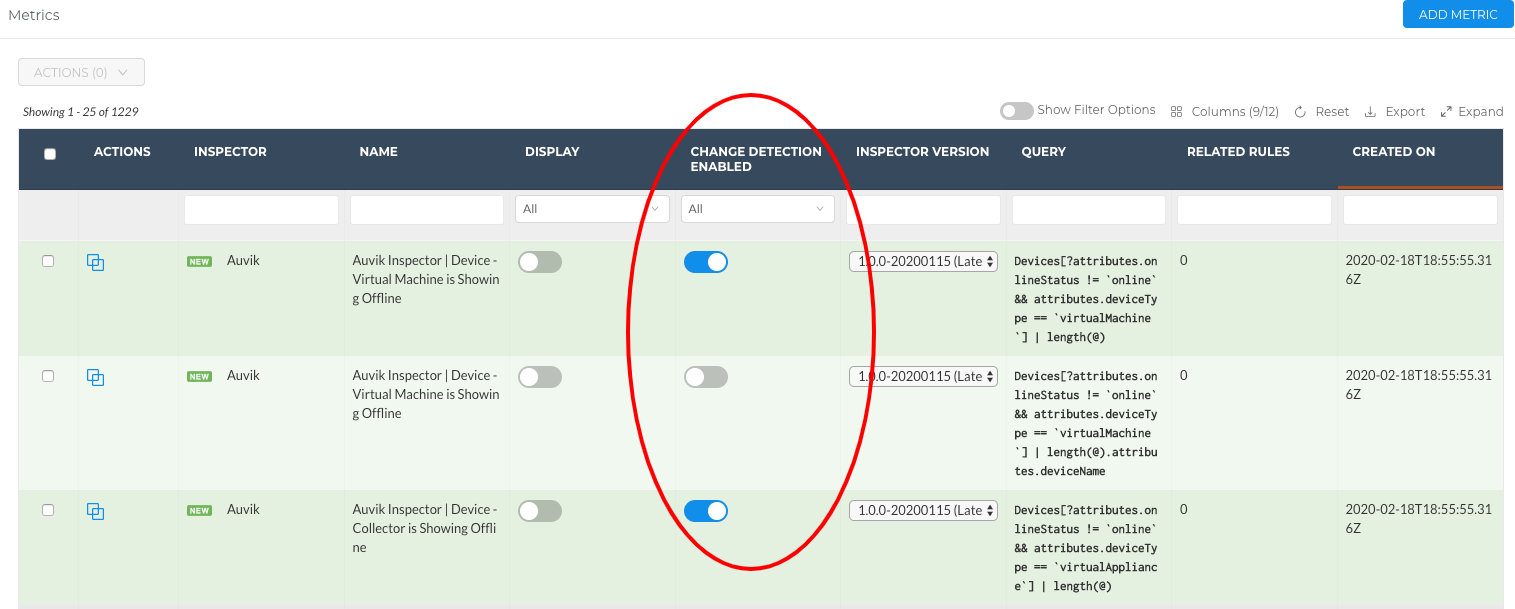
Because Liongard is collecting data daily, we are able to keep track of it using Liongard's timeline feature. On the timeline, Liongard has the ability to capture critical changes across the Systems you are managing, known as Change Detections. Change Detections are built on Metrics, meaning you have the ability to customize Change Detections.
To learn more about leveraging Metrics for Change Detections, please review our Change Detection documentation.
Standardize your Customer Support with Liongard's Actionable Alerts
Liongard's Actionable Alerts are built on Metrics. On the Metrics screen, The Related Rules column displays the number of Actionable Alert rules associated with each Metric. This includes if a Metric is used within a rule's conditional statement and/or added to a rule’s Alert Body or Comment.
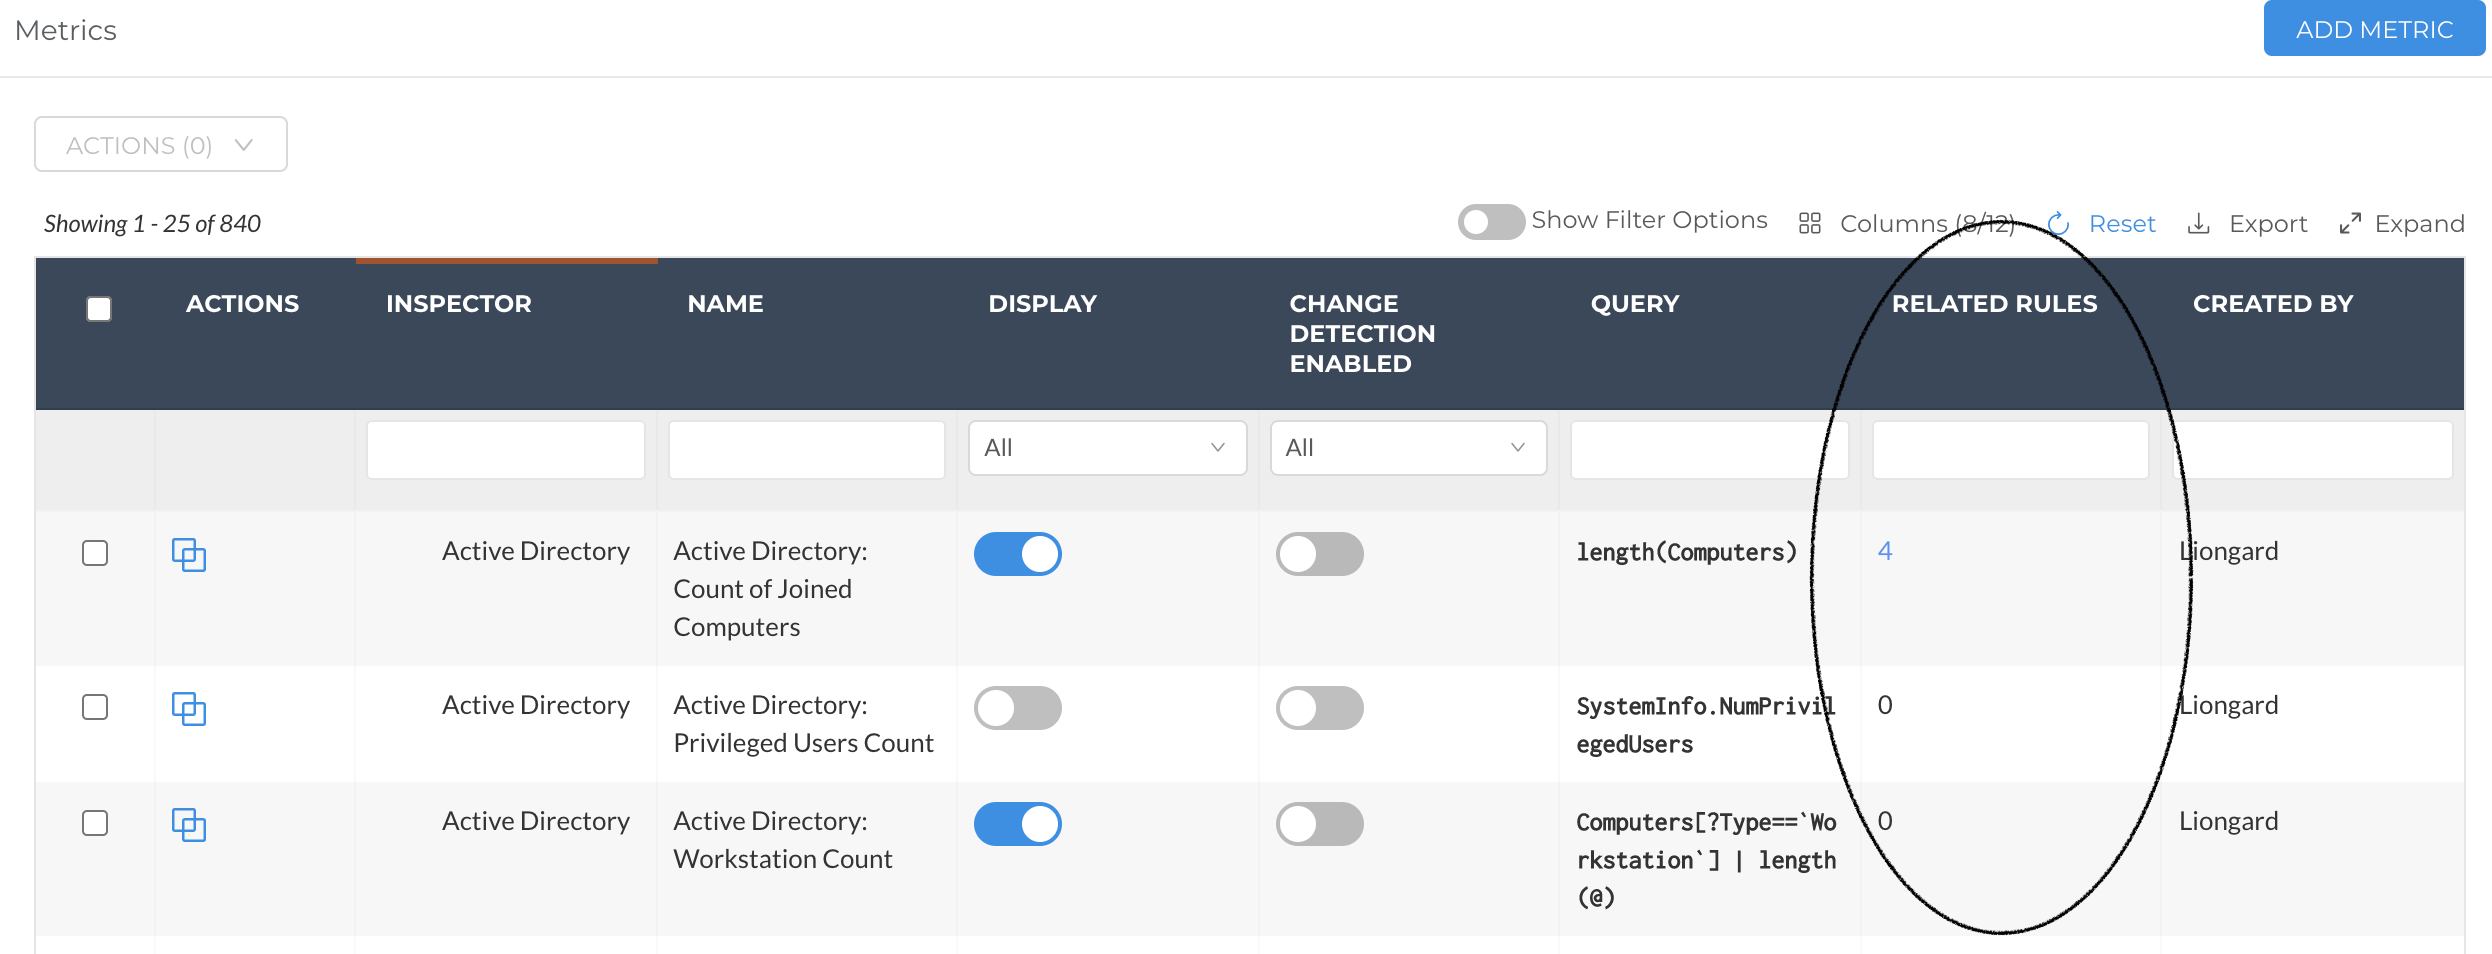
By clicking into the count, you will see which Rules are associated with this Metric.
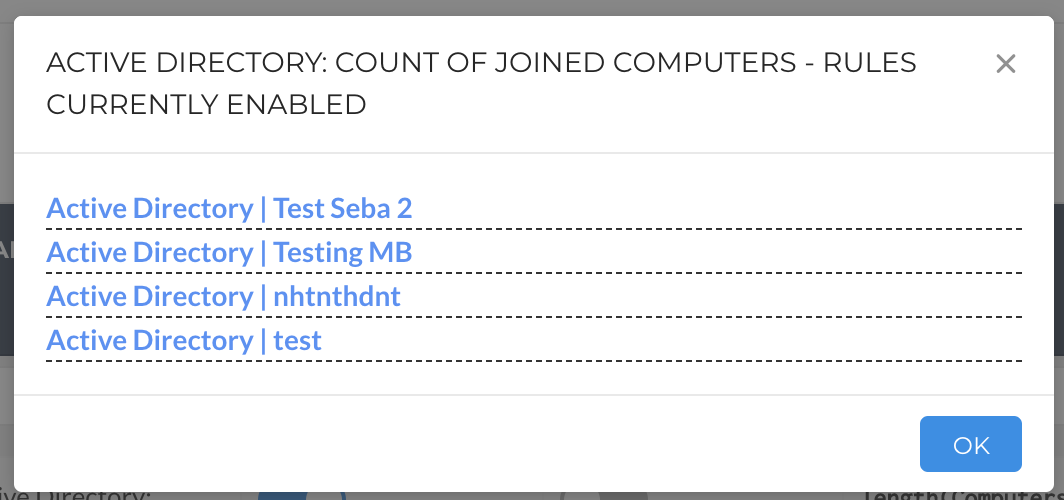
You can write your own custom Actionable Alert rules as well as leverage Liongard's prewritten rules to have proactive, automated alerts land in Liongard and/or your PSA or email.
Learn how to leverage Liongard's Metrics for Actionable Alerts in our Actionable Alerts documentation.
Report on the Data you and your Team Care Most About
Metrics are also the foundation of all Reports in Liongard. Review our Reports documentation to learn more.
Leverage Metrics in Third-Party Integrations
Metrics are also the foundation of some of our third-party integrations. For more information, review our Integrations documentation.
Liongard Library
Liongard has a community library, the Liongard Library, where Liongard users can share custom Metrics with other partners. You can access the Liongard Library in the Support drop-down menu in Liongard.
Check out the Liongard Library today!
Updated 5 months ago
