System Inspector Overview
What is a System Inspector?
A System Inspector is an individual micro-app that gathers information from the systems you manage. To access Inspectors, in Liongard, navigate to Admin > Inspectors.
Users can control how frequently Inspectors run. By default, System Inspectors are set to run daily.
System Inspector Dashboard
Navigating to Admin > Inspectors will take you to the Active Inspectors tab of the System Inspector Dashboard. The buttons at the top of the page can be used to filter the table for specific Inspector issues such as those with setup issues or failures.

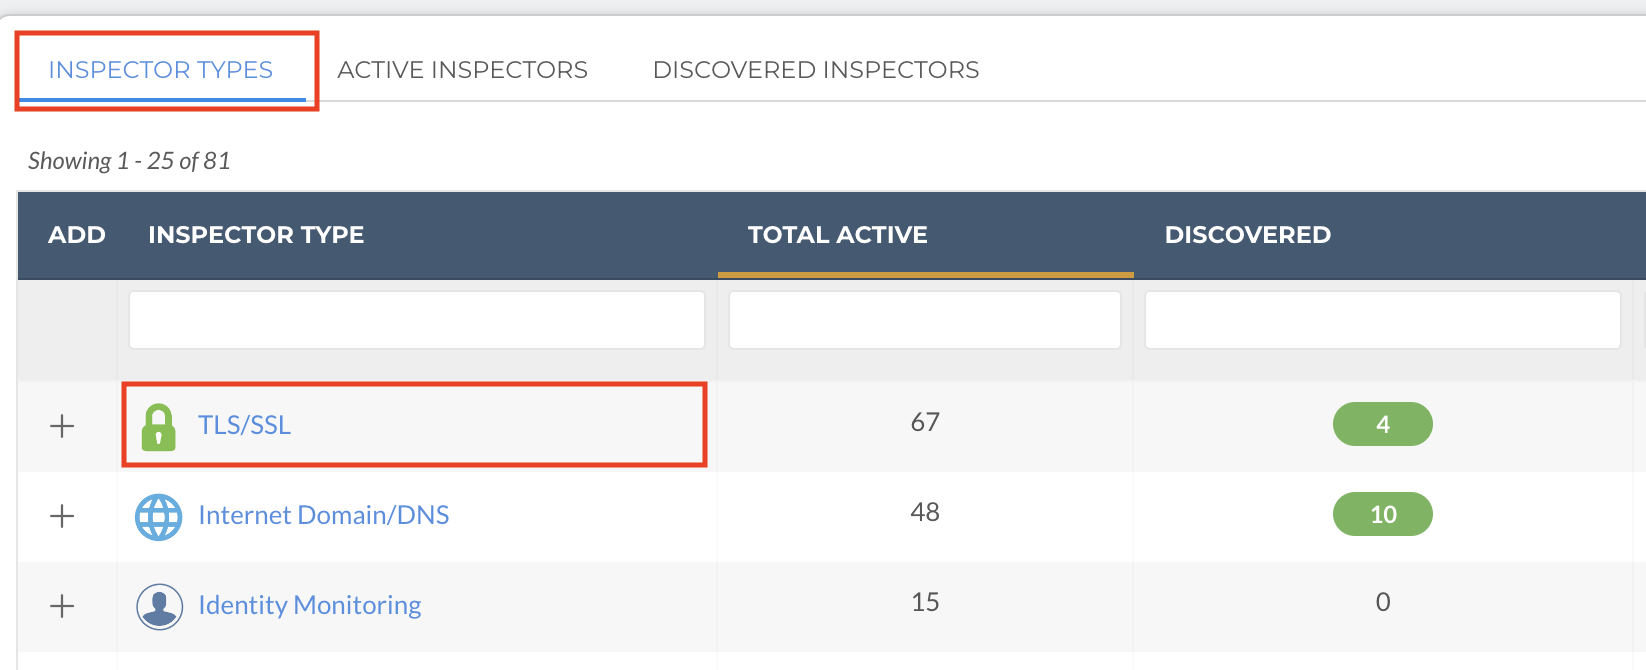
System Inspector Types
System Inspectors are organized by type:
In Liongard, to view Inspector types, navigate to Admin > Inspectors > Inspector Types

System Inspector Levels
| Inspector Status | Functionality |
|---|---|
| Production | Production Inspectors are in full production. Their data maps to IT Glue and ConnectWise. |
| Beta | Beta System Inspectors are System Inspectors that are currently in development. While in development, they can still bring valuable data back to your team. If an Inspector is in Beta, its data will not be pushed to IT Glue/ConnectWise. |
Endpoint Inspectors
Endpoint Inspectors, which include Linux, macOS, Windows Server, and Windows Workstation, provide deep visibility into endpoint devices.
Endpoint Inspectors are billed per unit according to your agreement with Liongard. Usage beyond the contracted amount will be charged on your monthly invoices.
Please contact your Account Manager for contract and pricing details.
To view your Endpoint Inspector count per Environment, navigate to Admin > Environments screen > Endpoint Inspector column

To view the number of included Endpoint Inspectors and your minimum commitment for Endpoint Inspectors, navigate to your username in the upper right-hand corner and select Company Settings.

How do System Inspectors work?
All Inspectors run on Agents, whether On-Premises or in the Cloud. When activated, the Inspector uses its predetermined authentication method to pull data from the target system.
Additionally, some Inspectors have Auto-Discovery capabilities that allow them to see/discover other Inspectors.
Once discovered, these System Inspectors will be left in a Discovered State for users to take action:
Scheduling Inspectors
By default, most Inspectors are set to run once a day. However, users can customize how frequently an Inspector runs in an Inspector's configurations. Most Inspectors can be set to run every eight hours. The Internet Domain/DNS and TLS/SSL Inspectors can be set to run every four hours.
For more information on scheduling Inspectors, review our Bulk Scheduling Inspectors for Distributed Start Times documentation.
How to Add a System Inspector
To add a System Inspector, navigate to the Admin > Inspectors > Inspector Types.
On the Inspectors page, navigate to the Inspector that you would like to add and click the plus sign in the Add column.

Complete the Configurations page according to the System Inspector's documentation, which can be accessed by clicking the question mark in the top right-hand corner.

When you are finished, select Save, and the Inspector will trigger to run within the minute.
Manual Inspector Setup
Inspector Setup in Bulk via CSV
For some Inspectors, it may be easier to add them in bulk via CSV.
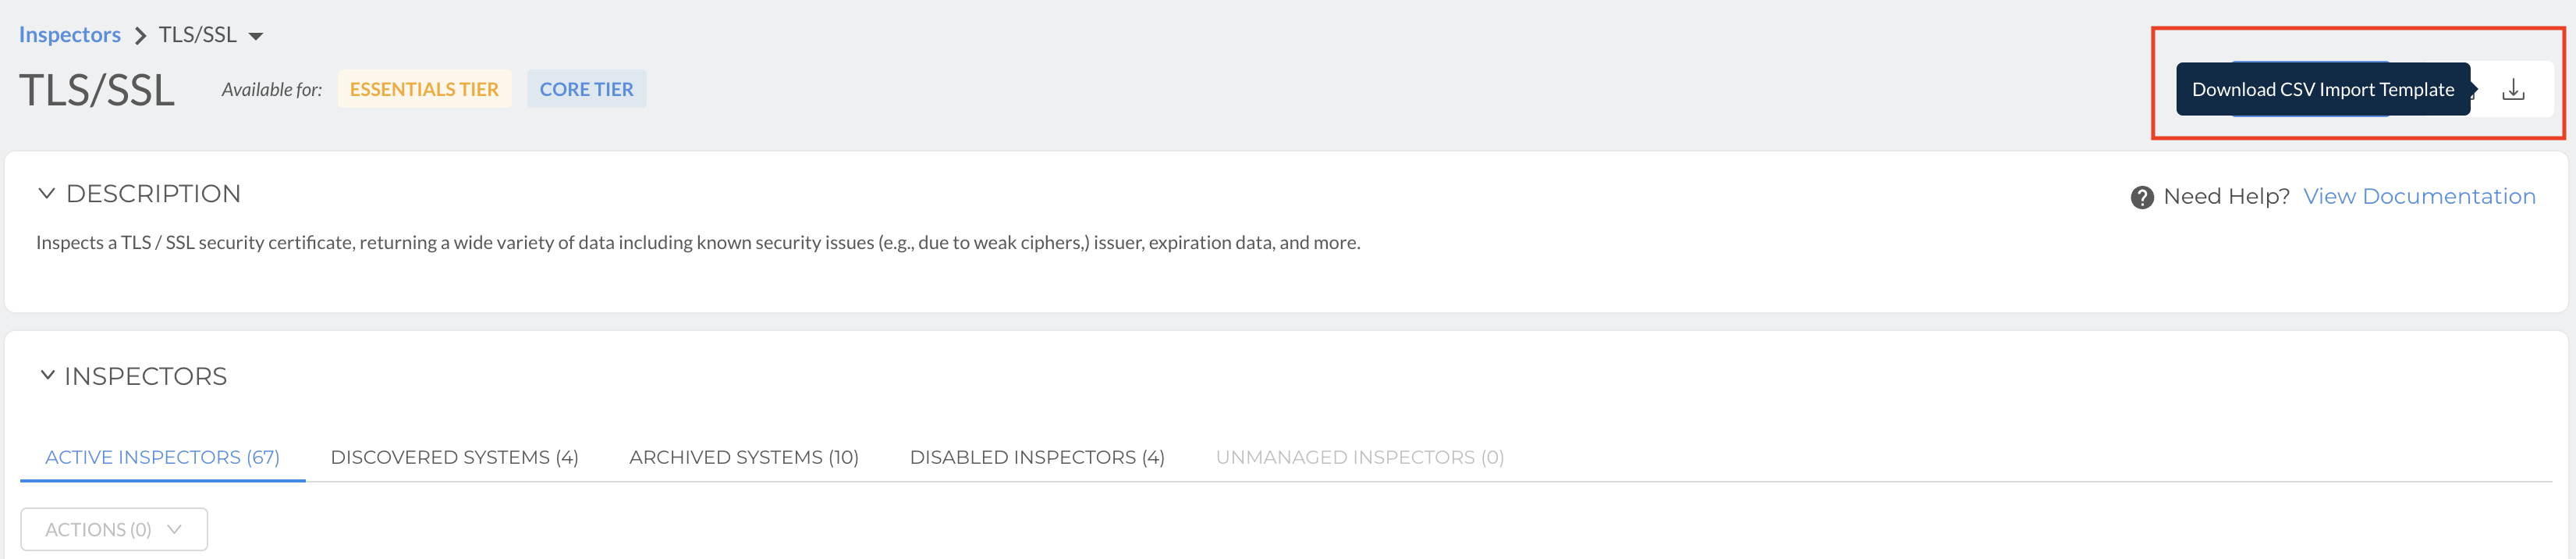
Navigate to Admin> Inspectors. Then, under Inspector Type, find your desired Inspector.
On the Inspector screen, select the Download CSV Import Template button.
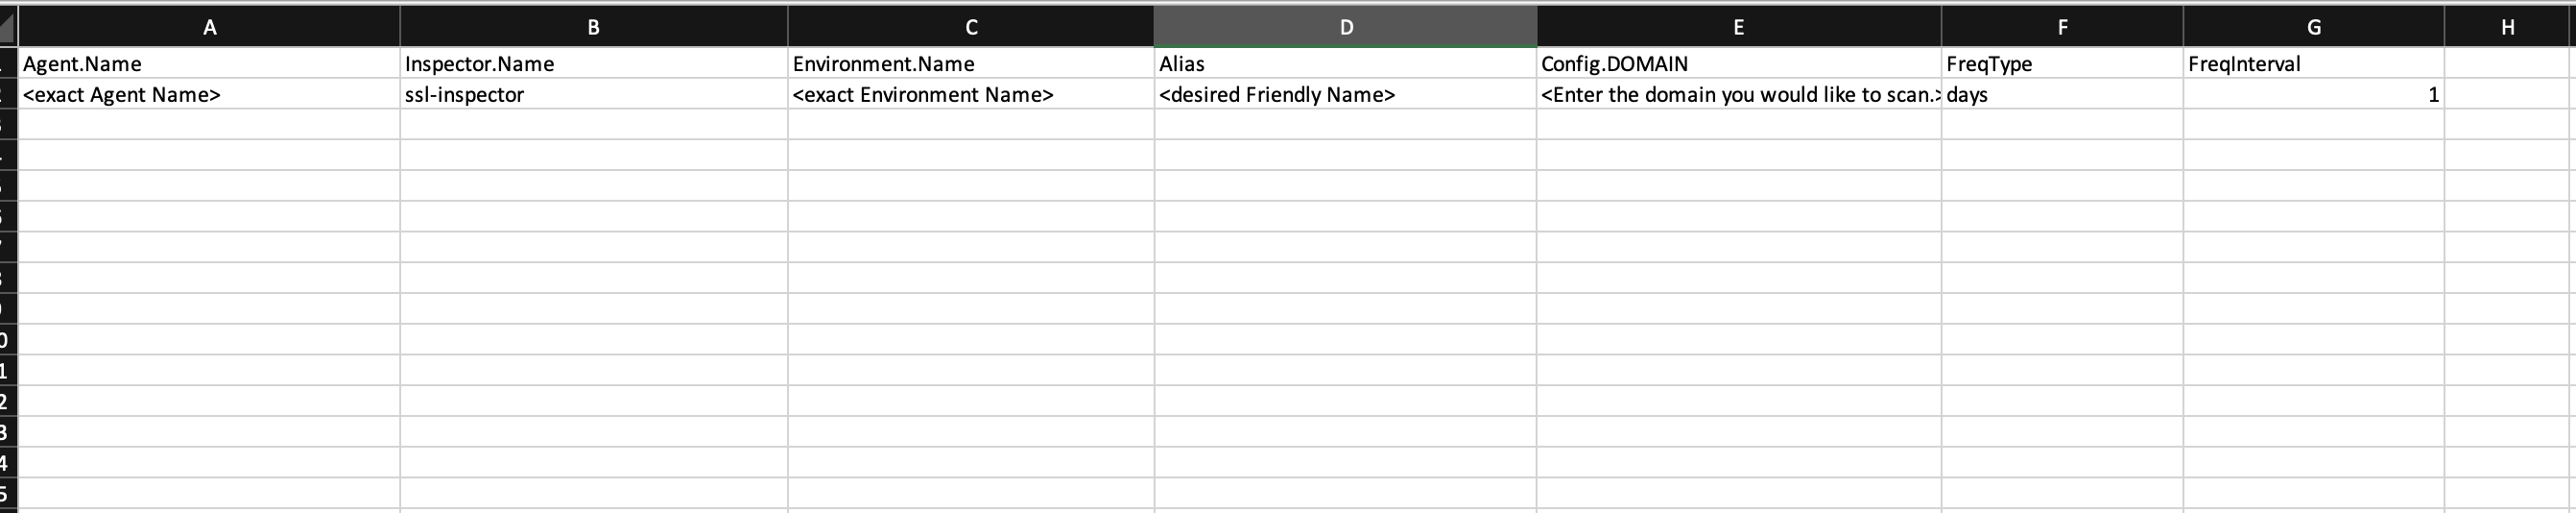
Fill out the CSV Import Template as you would in the single Inspector set-up screen.
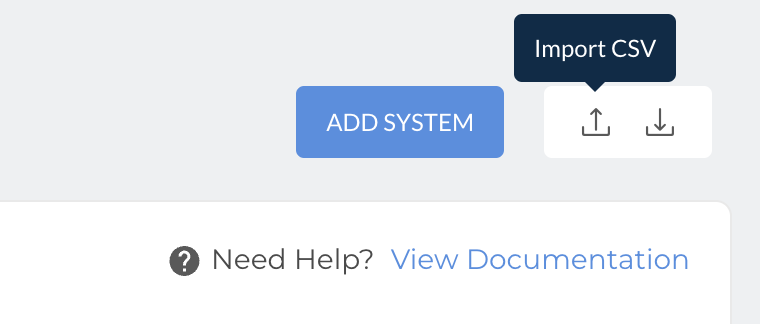
Upload the CSV Import Template using the Import CSV button on the Inspector screen.
How to Activate a Discovered System Inspector
Navigate to Admin > Inspectors. Then, click into your target Inspector and click on the Discovered Systems tab.

Select the checkbox(s) for the systems you would like to activate. Select the Actions button and click Activate Launchpoints.

Auto-Discovered Inspector Setup
Parent/Child Inspector Setup
How to Archive a Discovered System Inspector
Archiving a discovered System Inspector will prevent it from being discovered again.
To archive a discovered System Inspector, navigate to the Admin > Inspectors. Then, click into your target Inspector and click on the Discovered Systems tab.

Select the checkbox(s) for the systems you would like to activate. Select the Actions button and click Archive Launchpoints.

How to Enable an Archived System Inspector
To enable an archived System Inspector, navigate to Admin > Inspectors. Then, click into your target Inspector and click on the Archived Systems tab.
Select the checkbox(s) for the systems you would like to unarchive. Select the Actions button and click Unarchive Launchpoints.

These System Inspectors will move the Discovered Systems tab where you can activate them.
How to Force Run an Inspector
Force Running an Inspector will force the Inspector to run within the minute.
To force run an Inspector, navigate to Admin > Inspectors > Click into an Inspector > Select the Launchpoints you would like to run > Actions dropdown > Run Inspectors

Editing Active Inspectors
How to Bulk Edit Inspector Configurations
To edit multiple Inspectors in bulk, navigate to Admin > Inspectors > Click into an Inspector > Select the inspectors you'd like to edit > Actions dropdown > Edit.
This selection displays the “System Settings” configuration. Check a box next to the fields you want to update and enter a new value that will overwrite the existing launch point configurations. In this example, the “Disable External IP Scan” option is enabled for two selected launch points.

How to Disable an Active System Inspector
Disabling an active System Inspector will prevent the Inspector from running any additional inspections.
To disable a System Inspector, navigate to Admin > Inspectors. Then, click into your target Inspector. In the Actions column, click on the ellipsis icon and select Disable. This will move the Inspector to the disabled tab.

How to Bulk Disable Inspectors
To bulk disable Inspectors, from your Dashboard screen navigate to the Environments tab > Select the desired Environment > Select the Environment Admin Tab in the left sidebar, and then the Inspectors sub-tab.

Here, you can bulk select Inspectors > Select the Actions drop-down menu > Select Disable Inspectors
How to Troubleshoot a Failed Inspector
Inspectors experiencing Failures and/or Setup Issues will display on the Admin > Inspectors > Inspector Types screen.

To troubleshoot, review our Troubleshooting Inspector Failures documentatino.
How to Review an Inspector's Logs
To access Inspector logs:
- Navigate Admin > Inspectors
- Click into the Inspector for which you would like to view the logs
- Next to the System Inspector, select the log button
- Once selected, a screen will display showing the Inspector's logs

The logs will only display information based on the last inspection. The logs can be exported into Excel.

How to Delete an Active Inspector
Deleting an active System Inspector will prevent the Inspector from running any additional inspections, and it will delete all data collected in previous Inspections. Liongard does not recommend deleting Inspectors.
To delete a System Inspector, navigate to Admin > Inspectors. Then, click into your target Inspector. In the Actions column, click on the ellipsis icon and select Delete.

System Inspector Data Print
Liongard's Inspectors bring back data as a JSON object in a tree structure, called a Data Print. This Data Print appears as the last Data View Tab of each System Inspector, and has a 100MB limit. Inspections that exceed this limit will fail with an error message that indicates such.
This Data Print is utilized when creating custom Metrics and if the Data Print is larger than 25MB, you will need to use the Data Print Explorer view to see the data being returned.
Updated 11 months ago