How to Create a One-Time Report
How to Create a One-Time Report
To create a one-time use report, navigate to the Reports screen and select Create Report in the top-right of the Reports screen.

Step 1: Build the Report
- Select One-Time Report
- Name the report. Report names must be unique.
- Click Next

- Select the Environment(s)for which you would like to create the report. This will default to "All Environments."
Individual Environments can be selected using the pulldown or through the search icon. Multiple Environments can also be selected.

- Select the inspection date to be used for the report. This will default to the "Latest Inspection."
Click Change > Specific Date to pick a specific inspection date.
- If a specific date is selected, you can also specify a date range in the event that Metrics are not available for the date selected. If a range is selected, the report will display data from the most recent date, within the range specified, that has available Metrics. You can also elect to exclude systems with no data.
- When you are satisfied with the date, click Select.

- Select a report Output
- Selecting the checkbox for "All Environments in one report" will generate ONE report with ALL selected Environments.
- Selecting the checkbox for "Separate reports per Environment" will generate a DIFFERENT report for EACH Environment selected in the Reports builder.
- Selecting both checkboxes will generate both a consolidated report and a report for each individual Environment.
Step 2: Select Data
For each Report Section, you will select the Metrics you would like to report on for one Inspector Type. Use multiple sections to create a cross-System report.
- Title the report section. Each report section contains Metrics for one Inspector Type and you may create up to 15 sections per report.

- Select an Inspector that contains the Metrics you would like to include in the table.
- Select the Systems that should be included in the report. The Systems displayed are based on the Environments selected above. This field will default to "All Systems." Multiple individual systems can be selected using the pulldown or through the search icon.
- Select the Metric(s) that you would like to include in the report. You may select up to 15 Metrics per report section.
- If desired, add an additional section(s) for the report by clicking the + Add Report Section button and repeat Step 2.

- Sections can be reordered in the report by clicking the dots to the left of the section name and dragging the section to the desired location.

- If desired, a logo can be added to a report by clicking the Add Logo button in the top right corner of the report. Logos can be .png or .jpg formats and have a maximum allowed size of 1 MB.
- To delete a section, click the trash icon on the top right corner of the section that you would like to remove.

- As with all tables in Liongard, Reports tables can be filtered using the Show Filter Options at the top of the table. Any filter selections will be saved when the report is generated. To remove the filter options after a report has been created, select the Edit button on the report and use the Reset button at the top of the table.
Step 3: Generate the Report and Add Schedule
-
When you are finished building the report, click the blue Create button at the bottom of the screen.
-
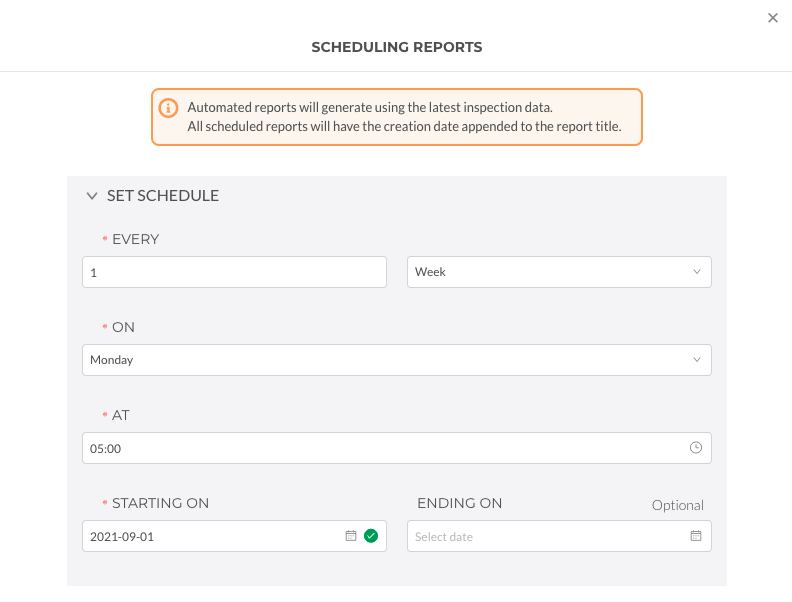
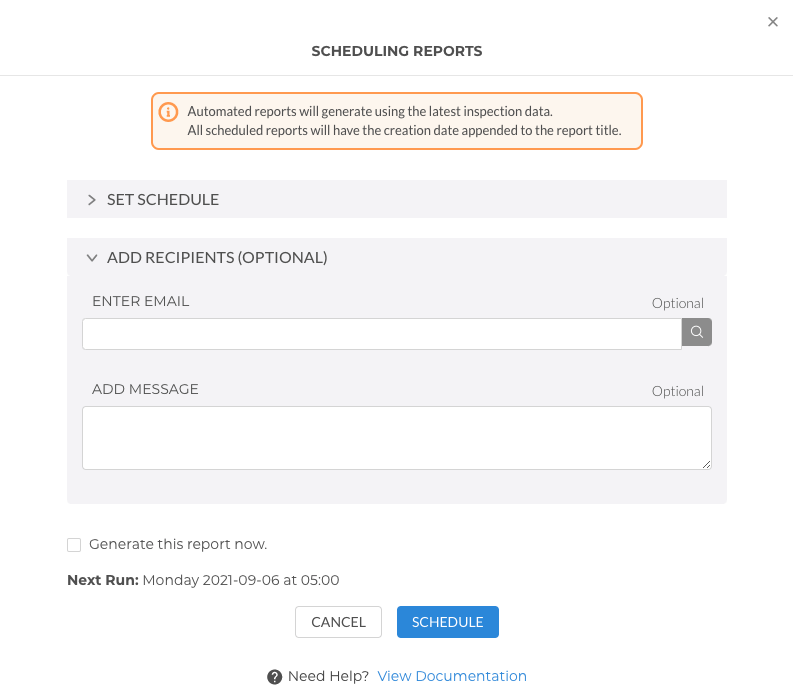
If desired, you can add a schedule the Report by clicking the add schedule button in the top right corner of the report. Complete the fields based on your desired schedule.

- Your report will generate based on the schedule selected.
- Once generated, the report will automatically appear in your Liongard instance under the Reports tab.
- Scheduled reports will be named using the original report name followed by the date the report was generated.

- Optional: Expand the Add Recipients panel to enter an email address(es). All entered emails will be sent a notification when the report has been generated and is ready to be viewed in Liongard. Click the Generate this report now button to run the report immediately.

- Your report can be downloaded in Excel or PDF format by clicking the download button in the top right corner of the report.
PDF limitations:
- Report sections can only can contain 9 or less Metrics
- Report sections cannot have more than 1,000 rows
- Reports cannot exceed 200 pages

Using the Reports Download ButtonWhen a Report is downloaded as an Excel spreadsheet or PDF, any filters that you have applied to the Liongard table will not be applied to the spreadsheet. Liongard is currently working on adding this functionality to the Reports feature and this document will be updated accordingly.
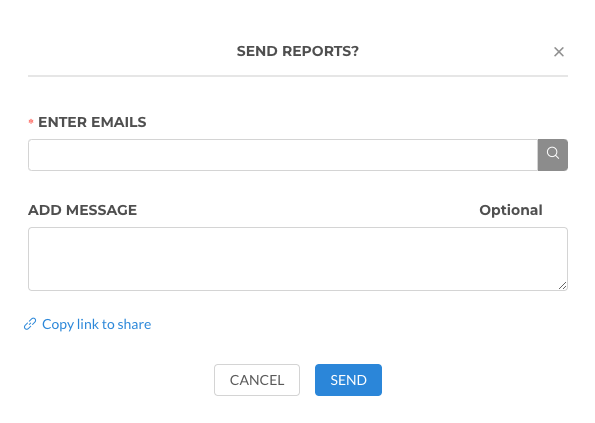
- To share the report click the share button in the top right corner of the report.

- "Enter Emails" will allow you to email a link to the report. This link will allow whoever is sent the link to access the report in Liongard. You can also add a message to the body of the email.
- "Copy Link to Share" will copy a link to the report in Liongard to your clipboard.

- The report can be edited or deleted using the corresponding buttons in the top right corner of the report.

- Once the report is generated, you can access the report in the Reports tab.
Updated 5 months ago
