How to Write a Metric
Liongard Academy
Learn more about writing custom Metrics with Liongard Academy's "How to Write a Metric" Learning Path, found at Liongard Academy.
Overview
Before creating a Metric, it is important to:
- Understand Liongard's Metric Builder
- Understand Liongard's Data Prints
- Understand JMESPath Queries
There are three ways to create a Metric:
Understanding Metrics
Understanding Liongard's Metric Builder

- Inspector: Select the Inspector for which you are building the Metric
- Name: Name of the Metric
- Metric Display: Enabling the toggle will display the Metric in Liongard and will make the Metric available to third-party integrations
- Change Detection Enabled: Enabling the toggle will turn on a Change Detection for the Metric
- Description: Description of the Metric
Query Builder
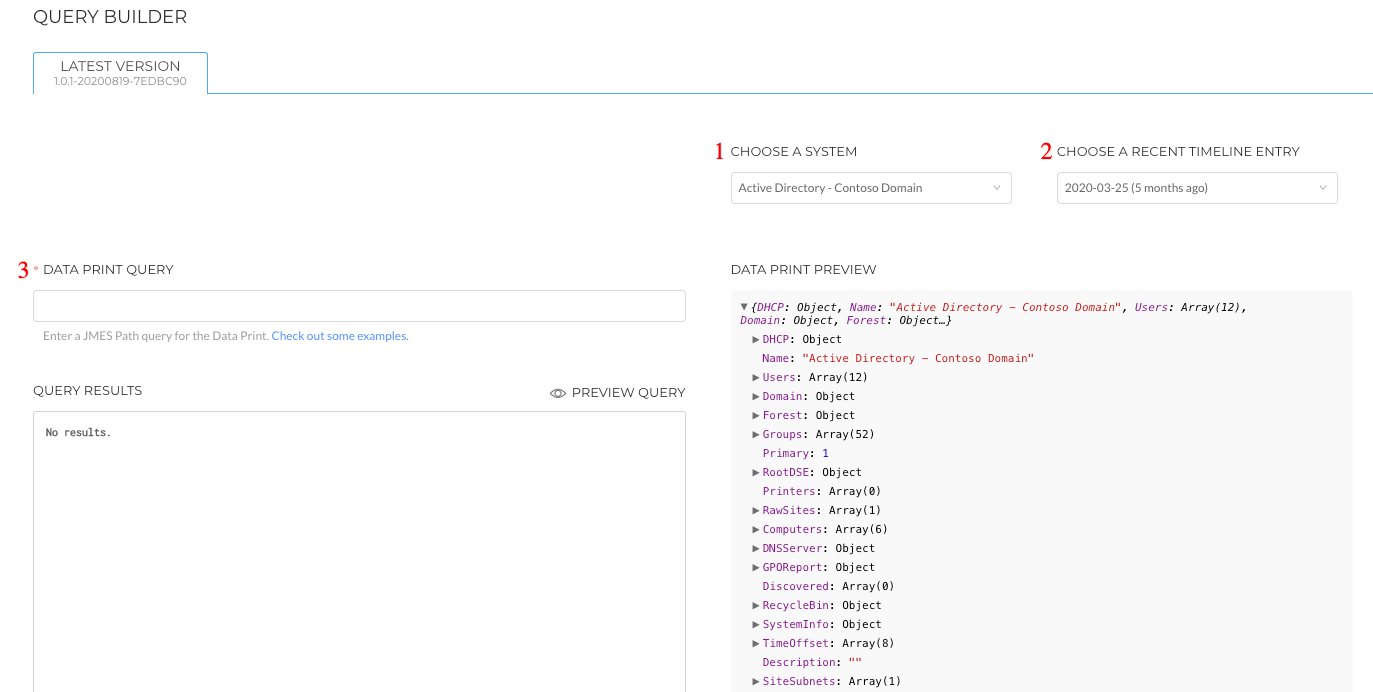
- Choose a System: Select the Friendly Name of an Inspector whose Data Print you'd like to explore in the Data Print Explorer
- Choose a Recent Timeline Entry: The desired timeline entry of the selected Inspector you would like to use as you build the Metric
- Data Print Query: Use JMESPath to write a query into the Data Print
- Data Print Explorer: Dynamic Data Print of the Inspector and timeline entry chosen in the Choose a System and Choose a Recent Timeline Entry fields
- Query Results: As you write the query, the output results will display here
- Preview Query: Selecting Preview Query will allow you to see the output of the Metric as it will be displayed in Liongard
Understanding Liongard's Data Prints
Liongard's Inspectors bring back data as a JSON object in a tree structure. This structure consists of objects and arrays.
- Object = A value; sometimes including subordinate values or lists of values
- Array = A list of multiple objects. Anything that ends in "[x]" (e.g. Users: Array [11])
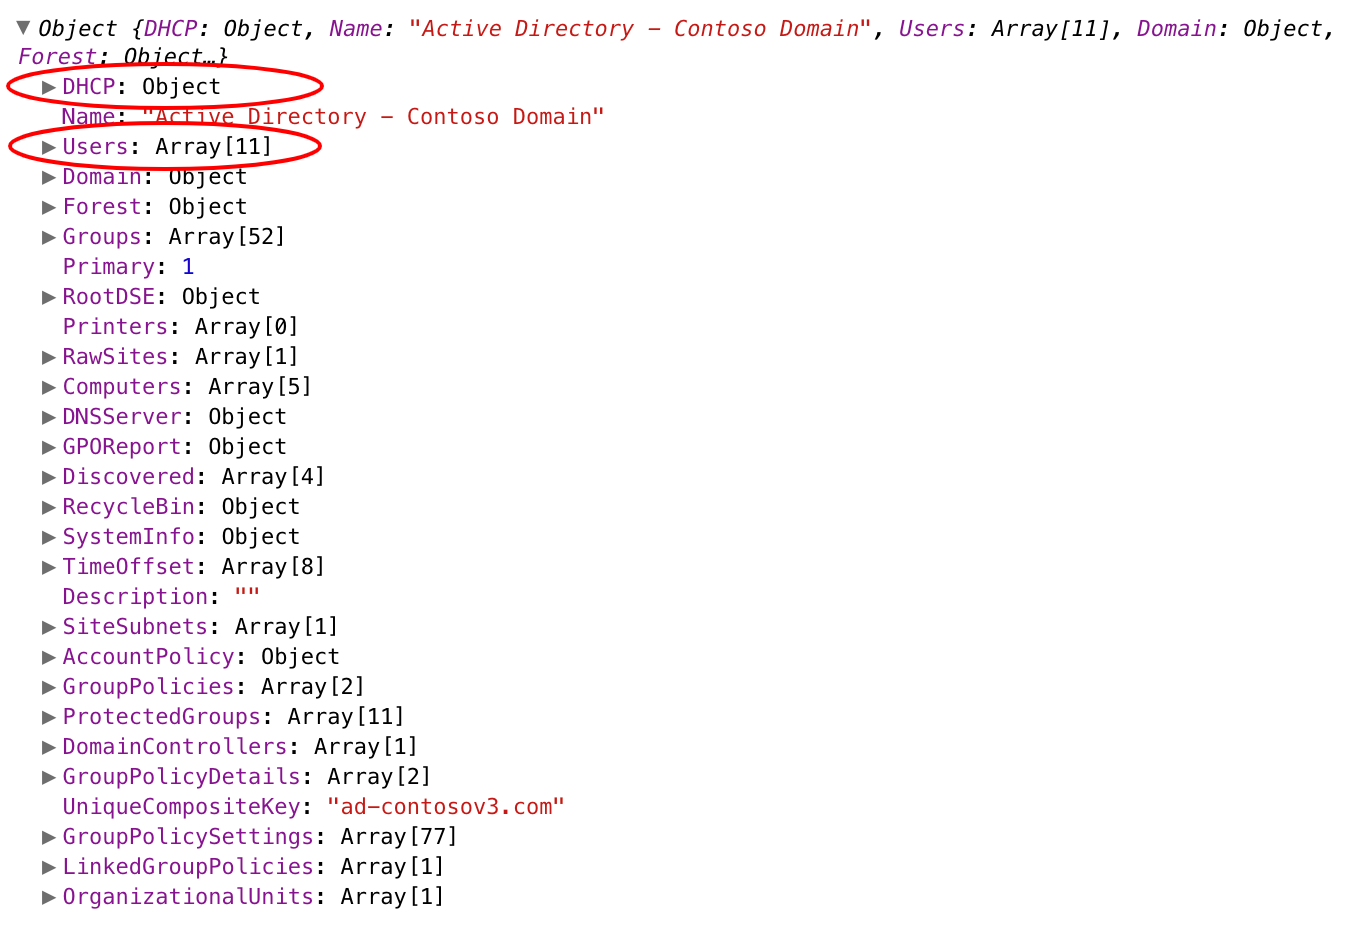
Above you can see both Objects and an Arrays

Above is an example of an Object
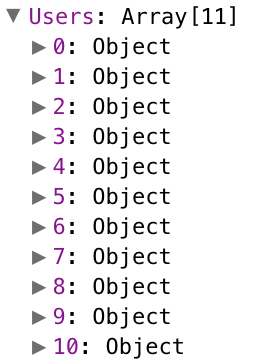
Above is an example of an Array
JMESPath Explained
For more information about JMESPath, please see some examples linked below:
JMESPath is a query language of JSON. It is made up of a path of commands.
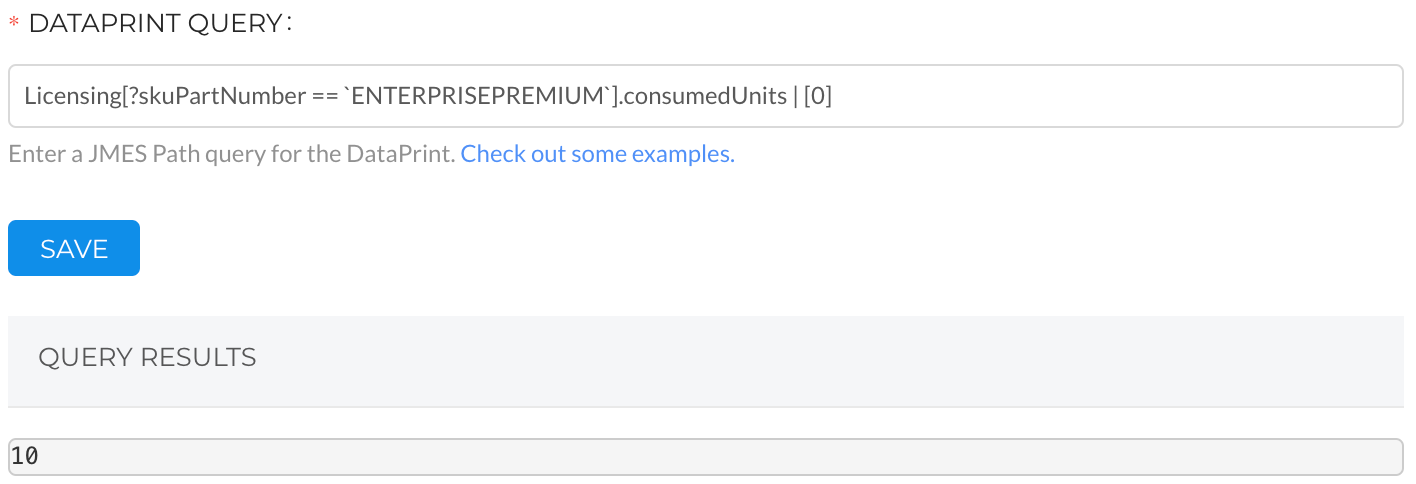
- What this query is saying: In the "Licensing: Array," where "skuPartNumber" equals "ENTERPRISEPREMIUM," tell me how many "consumedUnits" there are.
Notice the Query Results above match the number of "consumedUnits" in the Data Print below.
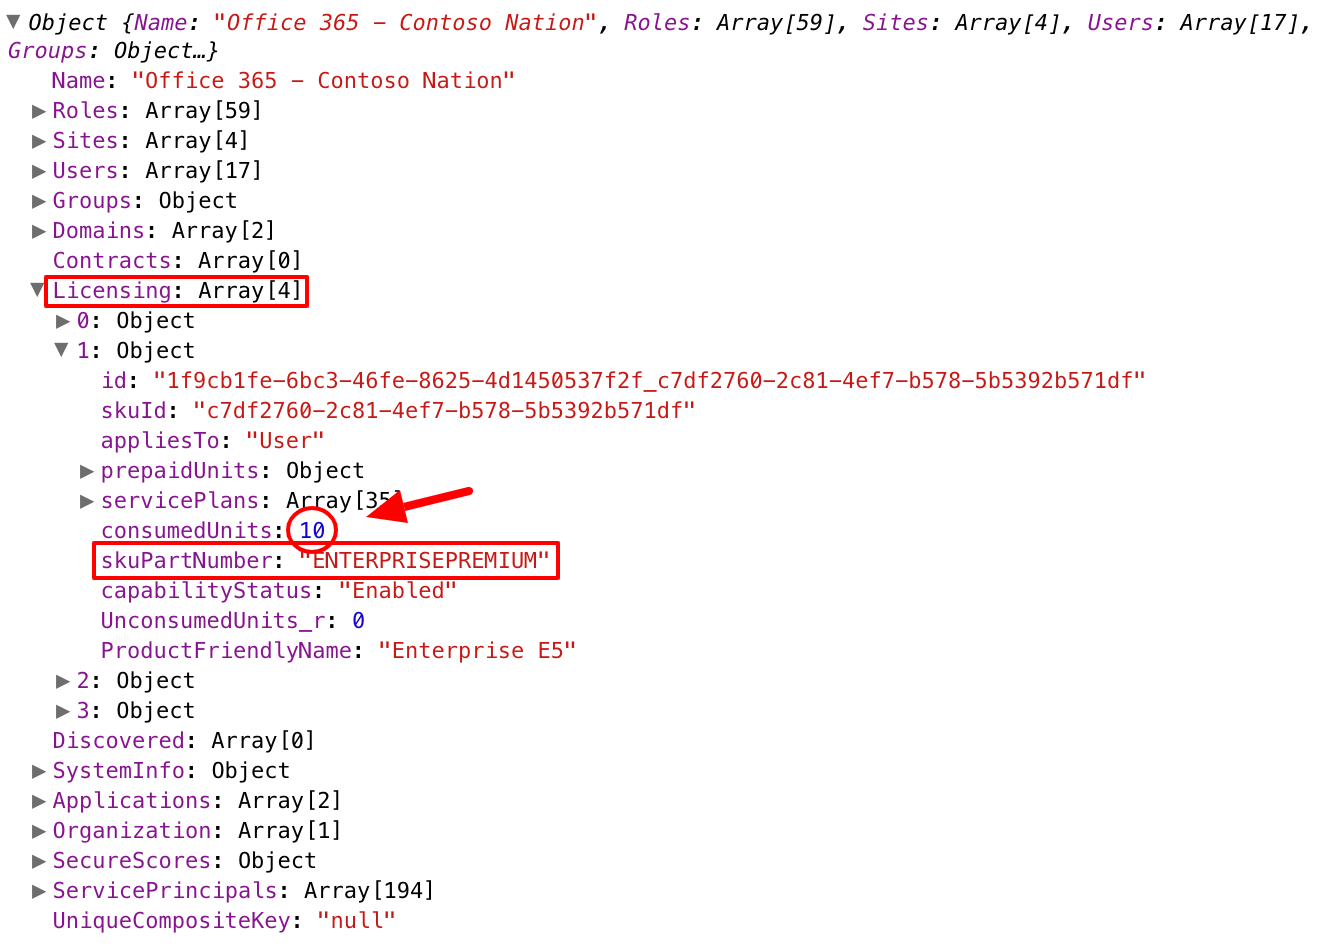
Example in Liongard
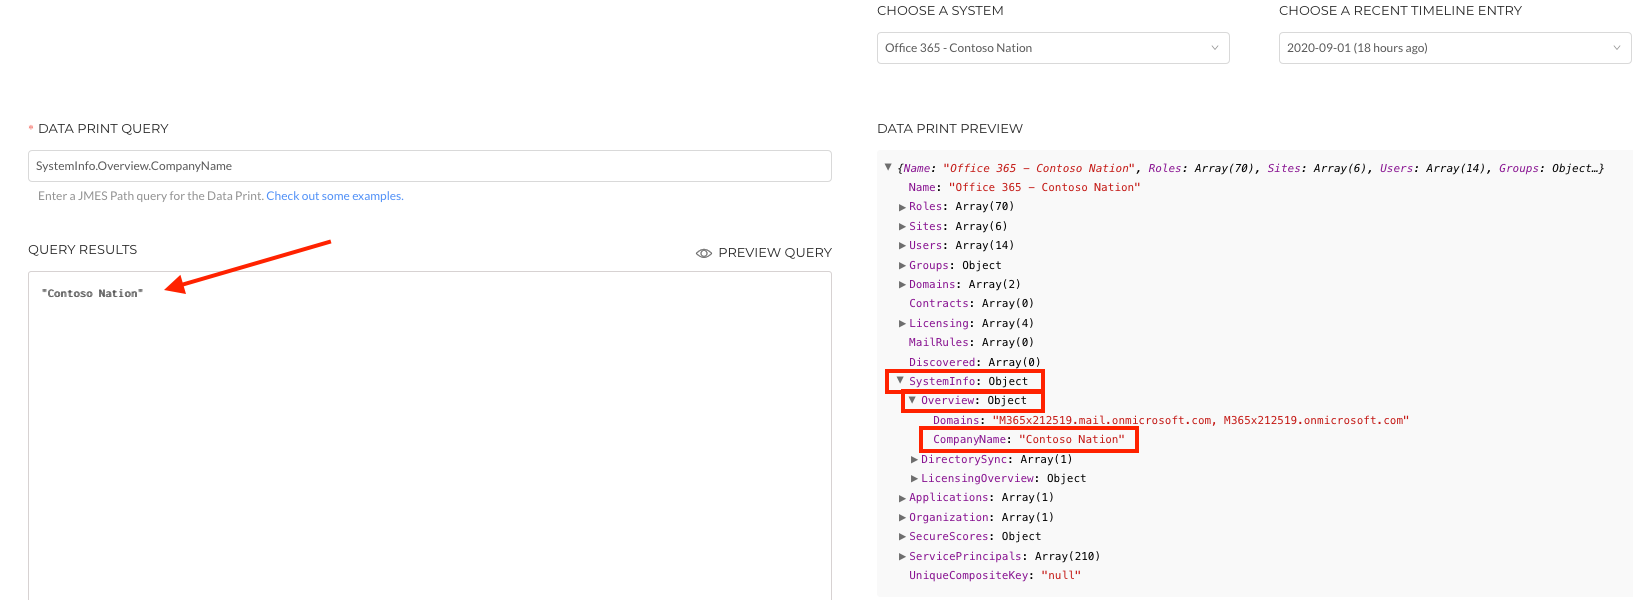
For example, above you see the Data Print Query: "SystemInfo.Overview.CompanyName"
- In the* Data Print Explorer you can see that the first command in the query is to start at the "SystemInfo" object
- The second command is "Overview." In the Data Print Explorer below, the "SystemInfo: Object" you can see another object titled "Overview"
- The Third command is "CompanyName." In the Data Print Explorer below, the "Overview: Object" you can see another object titled "CompanyName"
This path of commands leaves us at "CompanyName" which in the Data Print Explorer is "Contoso Nation." You can see in the Query Results "Contoso Nation" is returned.
How To: Write a Simple Query
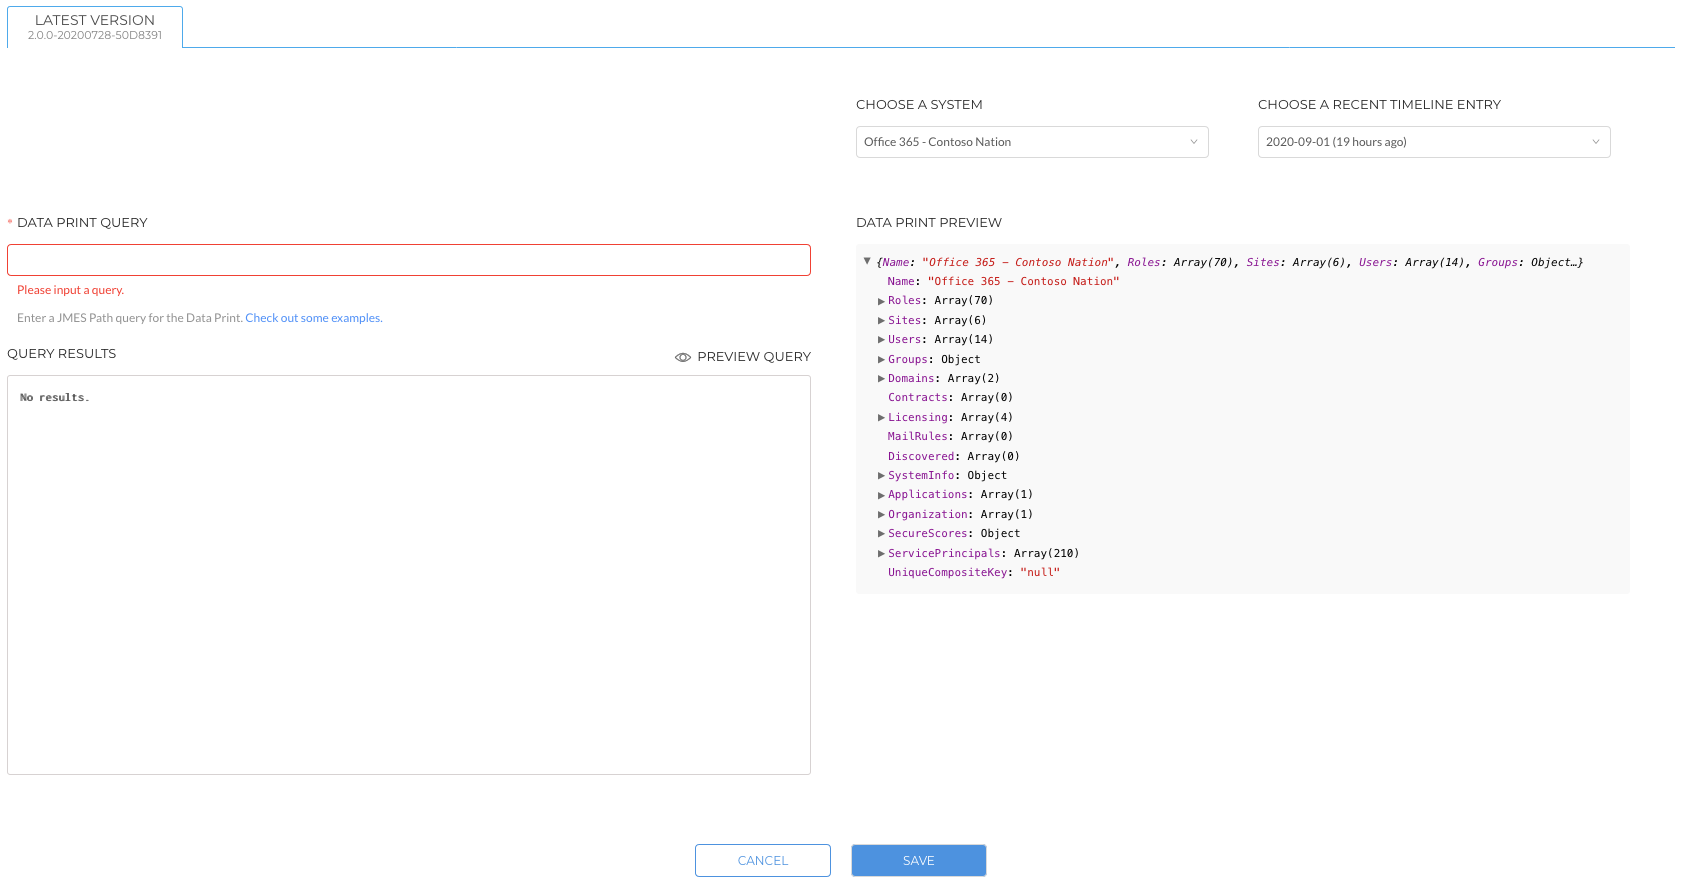
Above is a Microsoft 365 Inspector's Data Print. If you wanted to know about your users, you would start by directing the query towards the Users array (e.g. Users: Array [14]).
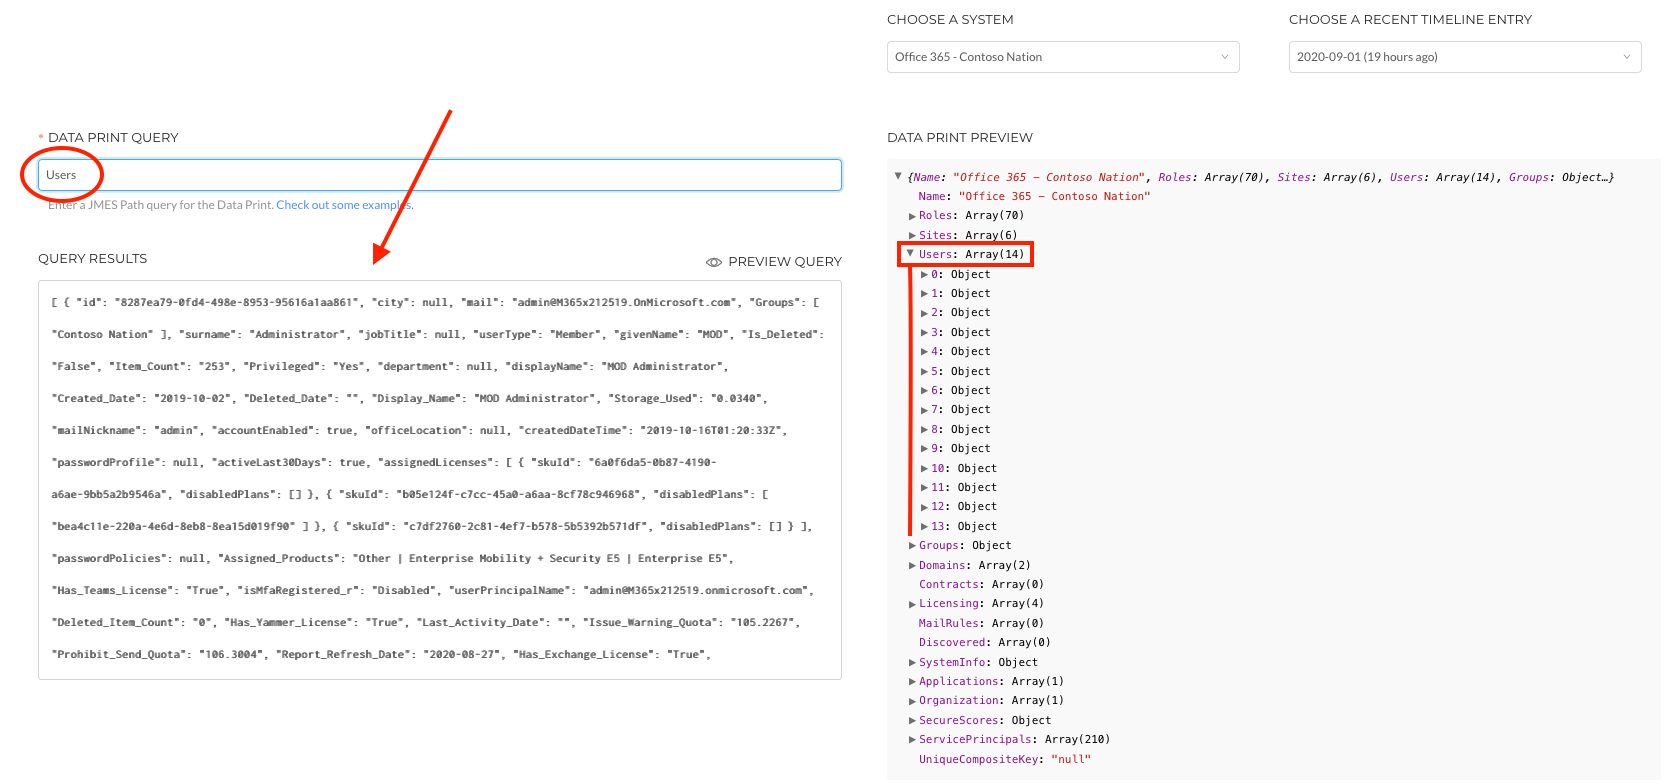
In the Query Results above you'll find that this query returns all of the variables under each of the 14 objects in this Users array.
- What this query is saying: Tell me about the users
How To: Use Functions
Now you might want to know how many users there are. To do this, you'll need to insert a function. For example, length is a JMESPath function that will return an aggregate from the array that it's directed towards.
- In JMESPath, functions can be applied to queries by starting the query with a function, and then surrounding the rest of the query in parenthesis (e.g. "length(Users)")
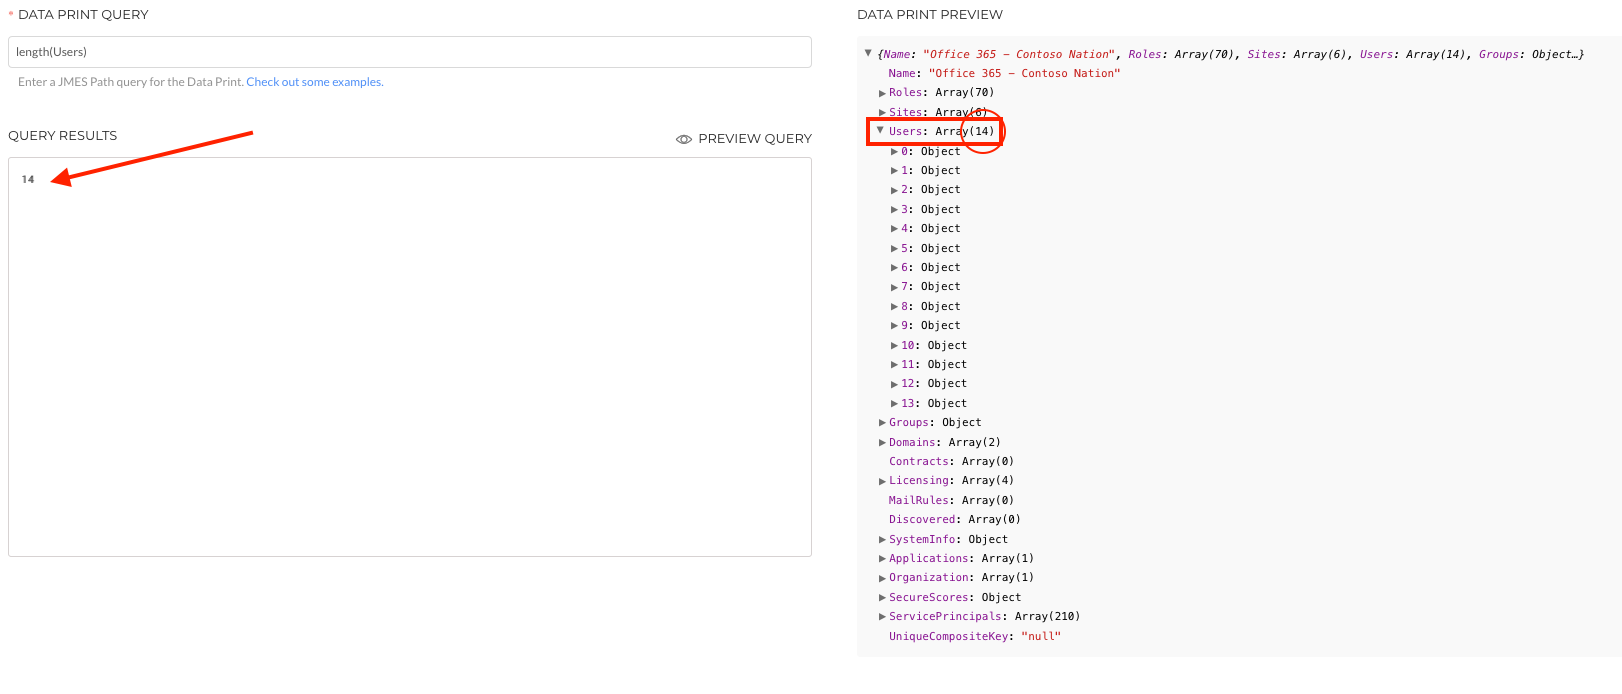
In the Query Results above, you'll find that this query returns the number of 365 users - 14. This can also be seen in the Data Print Explorer in the brackets following the Users array - 14.
Note: Each Microsoft 365 user is an object in the Users array
- What this query is saying: Tell me how many users there are
How To: Filter
Now you might want to know how many users have not been active within the last 30 days. To do this, you'll need to insert a filter. You can filter a query into an array by:
- In JMESPath, filters can be applied to queries by following the command to an array with brackets, a question mark, and the criteria that you want to filter by (e.g. "Users[?activeLast30Days ==
false]")
Notes:- "==" means "equals"
- "!=" means "does not equal"
- "<" means "less than"
- ">" means "greater than"
- the "`"s around "false" in the example above are back ticks (not apostrophes)
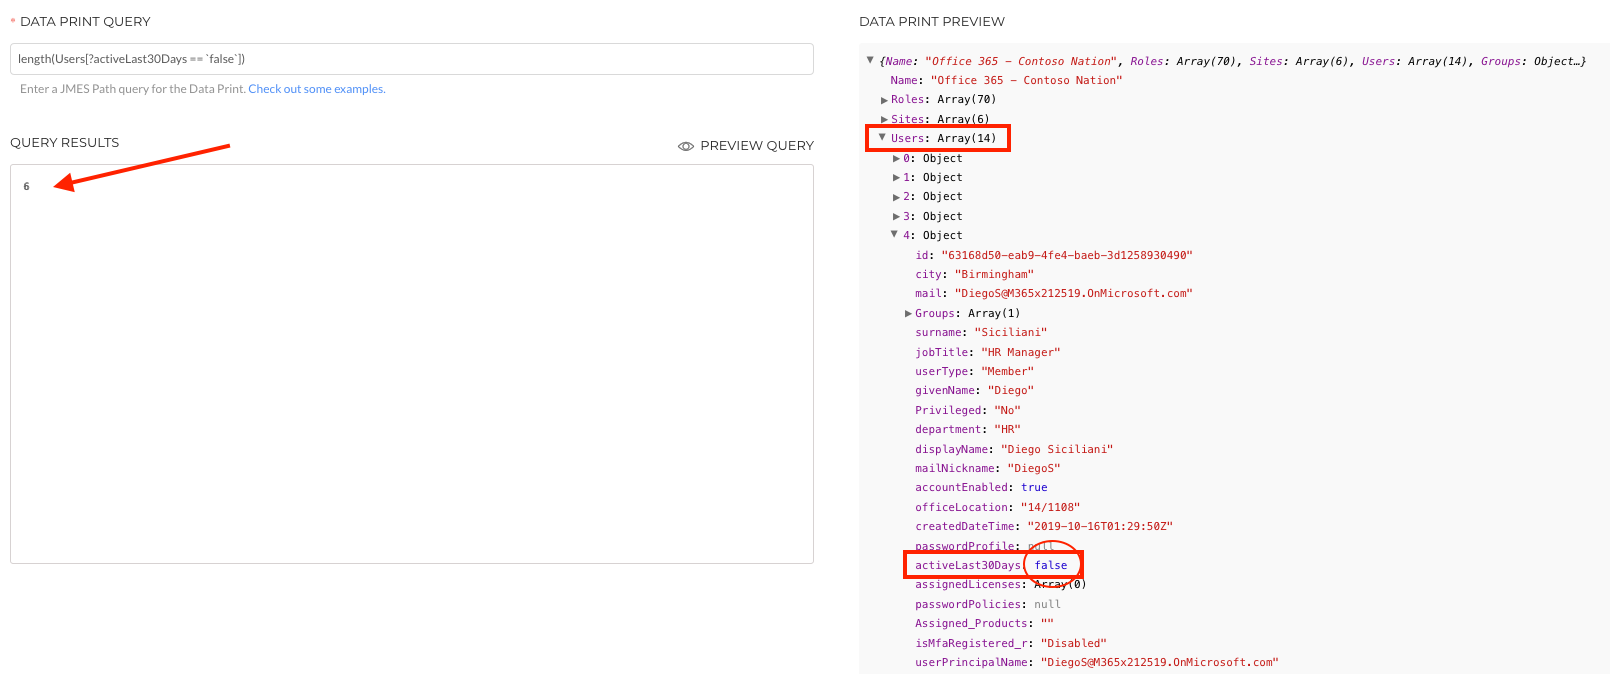
In the Query Results above you'll find that this query returns the number of 365 users that have been not been active in the last 30 days.
- What this query is saying: Tell me how many users there are where "activeLast30Days" equals "false"
Liongard JMESPath Extensions: RoarPath Commands
There are several Liongard JMESPath extensions and functions to make JMESPath more powerful and convenient. Review our documentation to learn more about Liongard RoarPath Commands.
Add a Metric from an Inspector's Data View
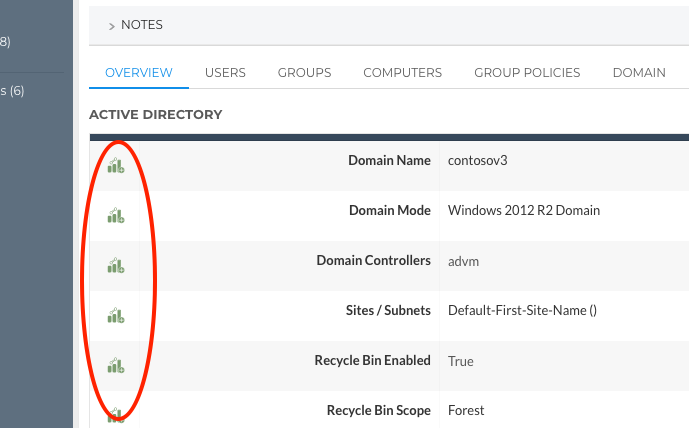
- Navigate to an Inspector’s Data View
- Click an "Add Metric" icon, located on the far left of “Key-Value” tables
What to Edit
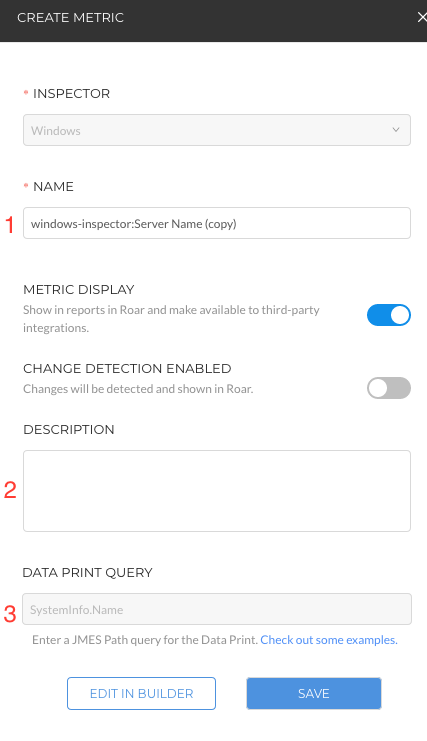
- Name: Edit to Include a Summary of the the Metric
- Description: (Optional) Edit to reflect a description of the Metric
- Data Print Query: Edit to query what you would like
When you are satisfied with the information in the above fields, the select Save, or select Edit in Metric Builder for further customizing.
Clone an Existing Metric
- Navigate to Admin > Metrics
- Explore the library of Metrics - search for a Metric similar to the Metric you wish to create
- Click on the blue "Clone" button on the left of the chosen Metric
What to Edit

- Inspector: Select the Inspector for which you are building the Metric
- Name: Name of the Metric
- Metric Display: Enabling the toggle will display the Metric in Liongard and will make the Metric available to third-party integrations
- Change Detection Enabled: Enabling the toggle will turn on a Change Detection for the Metric
- Description: Description of the Metric
Query Builder

- Choose a System: Select the Friendly Name of an Inspector whose Data Print you'd like to explore in the Data Print Explorer
- Choose a Recent Timeline Entry: The desired timeline entry of the selected Inspector you would like to use as you build the Metric
- Data Print Query: Use JMESPath to write a query into the Data Print
- Data Print Explorer: Dynamic Data Print of the Inspector and timeline entry chosen in the Choose a System and Choose a Recent Timeline Entry fields
- Query Results: As you write the query, the output results will display here
- Preview Query: Selecting Preview Query will allow you to see the output of the Metric as it will be displayed in Liongard
When you are satisfied with the information in the above fields, select Save.
Create a Metric from Scratch
Metric Character Limit
The Metric character limit is currently 1000 characters.
Cisco Meraki Metrics
If using a key with a period (i.e. "Switch.Count"), in the Data Query you must put the key in quotations for it to return an output. For example, "Switch.Count".
- Navigate to Admin > Metrics
- In the top right corner, select Add Metric
What to Edit

- Inspector: Select the Inspector for which you are building the Metric
- Name: Name of the Metric
- Metric Display: Enabling the toggle will display the Metric in Liongard and will make the Metric available to third-party integrations
- Change Detection Enabled: Enabling the toggle will turn on a Change Detection for the Metric
- Description: Description of the Metric
Query Builder

- Choose a System: Select the Friendly Name of an Inspector whose Data Print you'd like to explore in the Data Print Explorer
- Choose a Recent Timeline Entry: The desired timeline entry of the selected Inspector you would like to use as you build the Metric
- Data Print Query: Use JMESPath to write a query into the Data Print
- Data Print Explorer: Dynamic Data Print of the Inspector and timeline entry chosen in the Choose a System and Choose a Recent Timeline Entry fields
- Query Results: As you write the query, the output results will display here
- Preview Query: Selecting Preview Query will allow you to see the output of the Metric as it will be displayed in Liongard
When you are satisfied with the information in the above fields, select Save.
How to Write a Metric Learning Path
Looking for more Metric writing practice? Check out our How to Write a Metric Learning Path in Liongard Academy.
Updated about 1 month ago
